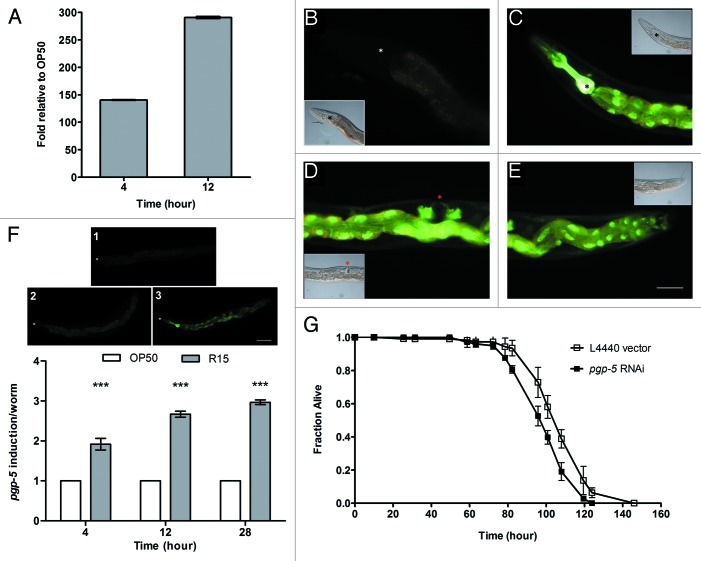
Figure 4. Transcription of host pgp-5 encoding the detoxification ABC-transporter was strongly induced in C. elegans infected by Bp R15. (A) qRT-PCR analysis of Bp R15-infected worms shows significant fold change of host pgp-5 transcription relative to E. coli-fed worms at 4 and 12 h of infection. Bars represent mean values ± SD. (B) Green fluorescence reflecting pgp-5 gene induction was weakly visible in uninfected ppgp-5::gfp transgenic worms. (C) However, at 28 h post-infection, the transgenic worms exhibited bright green fluorescence in the pharyngeal muscle, more prominently from the metacorpus to terminal bulb. Other loci of pgp-5 expression observed included (C--E) the entire intestine and (D) gonad. For (B--E), DIC images are displayed as insets either on the lower left or on upper right of the corresponding images. (F) Shown in the upper panel are the criteria used for scoring ppgp-5::gfp transgene expression upon Bp R15 infection. Bars in the lower panel correspond to the mean ± SD of pgp-5 induction scores (expressed in arbitrary units) for each worm (n = 20). (G) C. elegans exhibited increased susceptibility to Bp R15 infection upon RNAi knock-down of pgp-5. Graph shows the mean ± SD of the live worm fraction (n = 120). Images (B–E) are overlaid images captured using I3 and N2.1 filter cubes, therefore the green fluorescence region appears slightly yellowish while the non-specific gut autofluorescence is in orange. Asterisks in (B and C) mark the terminal pharyngeal bulb whereas those in (F) mark the worm nose. The red asterisk in (D) points to the vulva. Images (B–E) were taken at 400× magnification while images in (F) were captured at 100× magnification. Scale bars in (E and F) represent 50 µm and 100 µm, respectively.

An official website of the United States government
Here's how you know
Official websites use .gov
A
.gov website belongs to an official
government organization in the United States.
Secure .gov websites use HTTPS
A lock (
) or https:// means you've safely
connected to the .gov website. Share sensitive
information only on official, secure websites.
