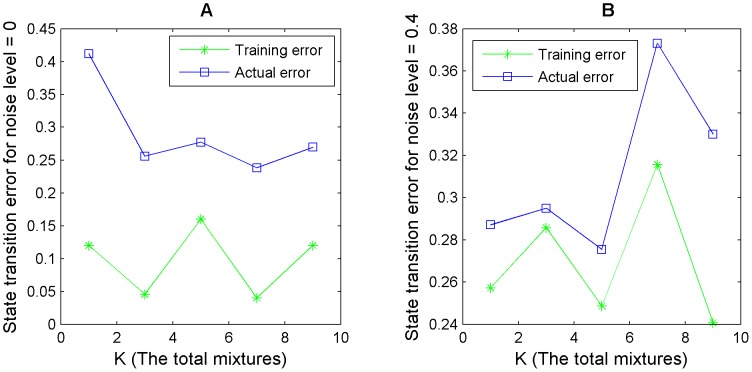
Figure 4. Model selection strategy adopted for choosing the best value of  using the training set error as a criterion for selection.
This figure is a plot of values shown in Table 2. Here the training error along with the state transition error for different  values is plotted for noise levels 0 and 0.4. The rules were generated for node
  (indegree 9) of the 10 node network. We can see that generally, a higher training set error corresponds to a higher state transition error and vice versa.

