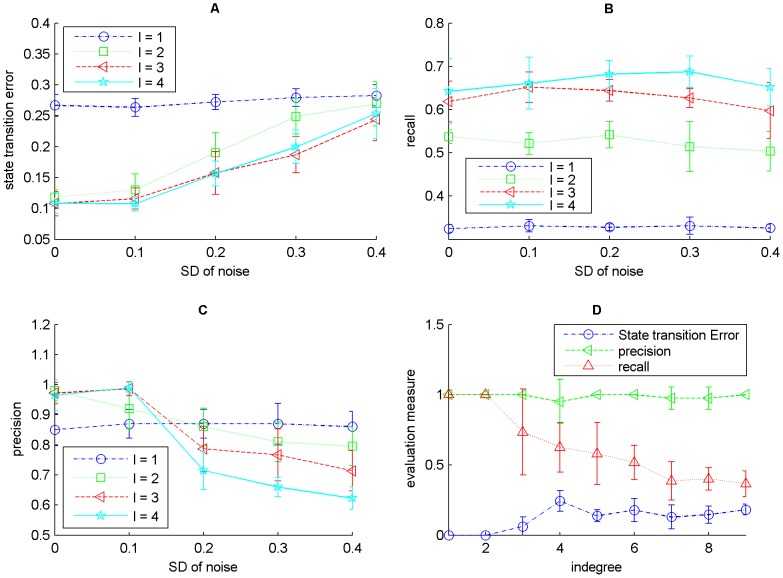
Figure 7. Evaluation of the network with varying indegrees using REVEAL.
Figure A is the noise level vs. state transition error, Figure B is a plot of noise level vs. recall and Figure C indicates the noise level vs. precision. Noise level is the standard deviation  of Gaussian distribution with zero mean. In Figure D different evaluation measures are plotted for different indegrees for noise level 0.1 and indegree
  . All experiments were carried out using 10 simulations.

