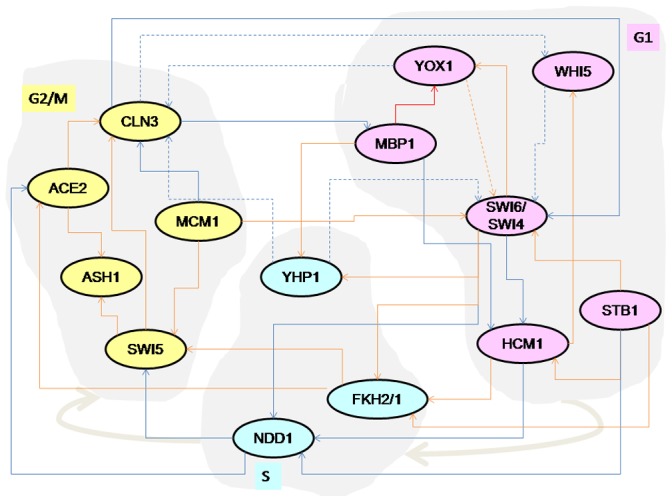
Figure 9. Transcription factor network of the yeast cell cycle inferred by Orlando et al. and Pramila et al.

Solid lines indicate activating interactions and dashed lines indicate inhibitory interactions. The transcription factors of the cell cycle time line are indicated by the gray blobs (G1 S
S G2/M). The interactions shown in red were correctly identified by ReBMM and the interactions shown in blue were not identified.
