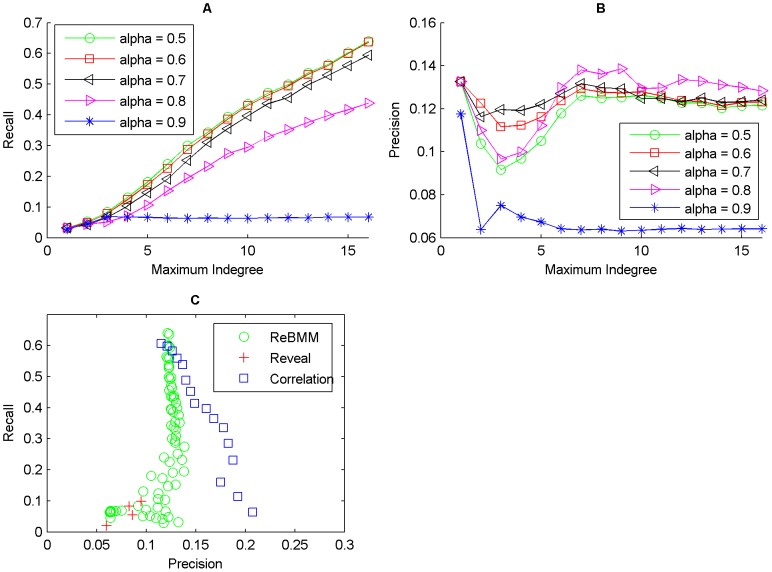
Figure 12. Reconstruction of network for the cdc28 experiments of the yeast cell cycle microarray data.
Figure A shows the recall against maximum indegree for ReBMM for different  values. Figure B illustrates the plot for precision. The comparison of ReBMM, correlation and REVEAL is displayed in Figure C. Here the performance of correlation is better than the rest of the methods.

