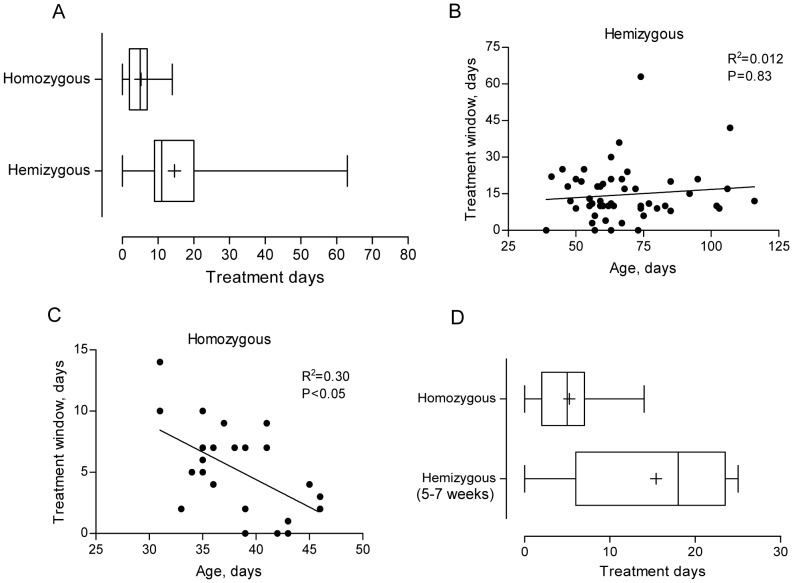
Figure 3. Time from a palpable tumor to sacrifice – the treatment window.
A. Treatment window for homozygous and hemizygous mice. Mean number of treatment days for homozygous mice was 5.2 days (median 5, n = 30) and for hemizygous mice 15 days (median 11, n = 54). Statistical analysis was performed using two-sided t test on log-transformed data; p<0.01. B. Treatment window for hemizygous mice as a function of age at tumor palpation. Linear regression analysis yielded R2 = 0.012 and the correlation was assessed using two-sided Spearman test; p = 0.83. C. Treatment window for homozygous mice as a function of age at tumor palpation. Linear regression analysis yielded R2 = 0.30 and the correlation was assessed using two-sided Spearman test; p<0.05. D. Treatment window for homozygous mice versus hemizygous mice with an early tumor development (5.6–7.0 weeks of age). Mean number of treatment days for homozygous mice was 5.2 days (median 5, n = 30) and for hemizygous mice with an early tumor development 15 days (median 18, n = 5). Statistical analysis was performed using two-sided t test on log-transformed data; p<0.01. Box plots show median, inter quartile range (25–75%), min and max, and + represent the mean.

