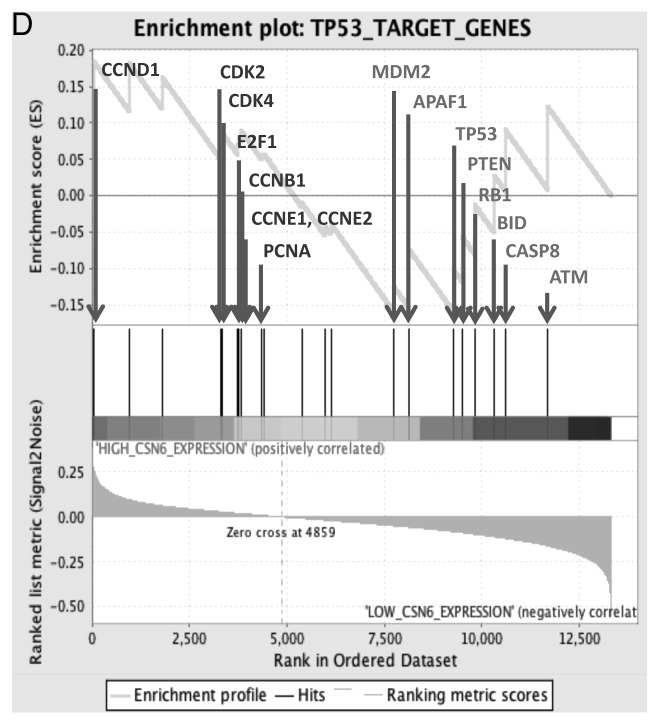
Figure 6D. (D) Enrichment score graph and Ranked list metric graph showing the upregulation of p53-suppressed target genes in CSN6-highly expressing patients (Gene Set Enrichment Analysis, Broad Institute, MIT. Cohort: GSE-20194 consisting of 255 untreated stage I–stage III breast cancer patients at MD Anderson Cancer Center. Blue, p53-suppressed target genes; red, p53-activated target genes.

An official website of the United States government
Here's how you know
Official websites use .gov
A
.gov website belongs to an official
government organization in the United States.
Secure .gov websites use HTTPS
A lock (
) or https:// means you've safely
connected to the .gov website. Share sensitive
information only on official, secure websites.
