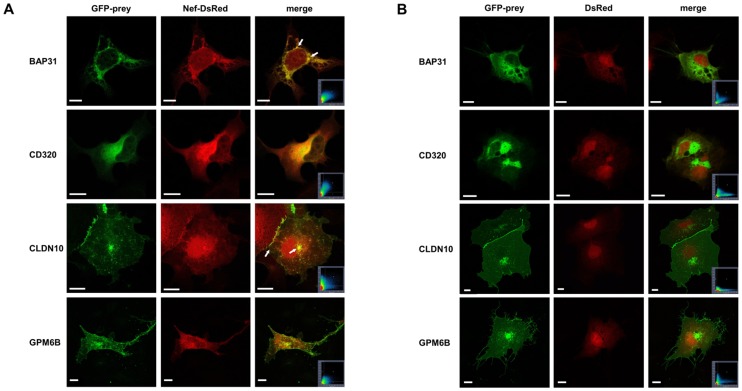
Figure 2. Analysis of subcellular localization of BAP31, CD320/TCblR, CLDN10 and GPM6B with and without Nef.
A. Confocal microscopy analysis of Cos-7 cells coexpressing GFP fusions of BAP31, CD320/TCblR, CLDN10 or GPM6B with Nef-DsRed. Cos-7 cells were transiently cotransfected with pNef-DsRed and pGFP-BAP31, pGFP-CD320/TCblR, pGFP-CLDN10 or pGFP-GPM6B and fixed 24 h posttransfection. Single images from the red (Nef-DsRed) and green (GFP-prey) channels were overlaid in the merged image. Yellow regions represent colocalization, details are given in the text. Arrows point out BAP31 accumulations and distinct areas of CLDN10 and Nef overlay. Scale bar: 10 µm. B. Negative controls for the colocalization images in Figure A. Confocal microscopy analysis of Cos-7 cells coexpressing GFP fusions of BAP31, CD320/TCblR, CLDN10 or GPM6B with DsRed. Cos-7 cells were transiently cotransfected with pDsRed and pGFP-BAP31, pGFP-CD320/TCblR, pGFP-CLDN10 or pGFP-GPM6B and fixed 24 h posttransfection. Single images from the red (DsRed) and green (GFP-prey) channels were overlaid in the merged image. The respective scatter grams, as well as the images and scatter grams from cotransfections with the pDsRed control vector are given.

