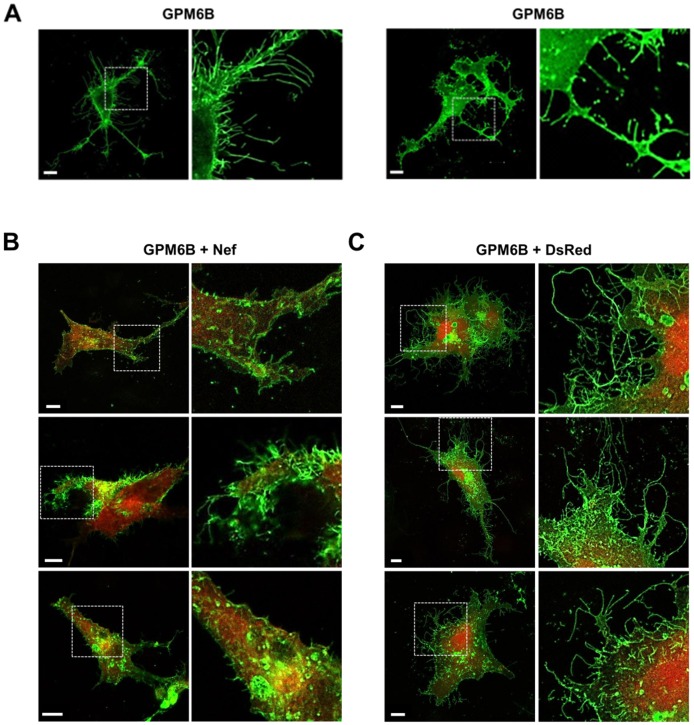
Figure 3. Analysis of GPM6B-induced outgrowth in Cos-7 cells.
Cells were treated as described in Figure 2. For enhanced visualization of the membrane extensions, magnifications of the boxed areas are depicted to the right of each picture. Representative images of cells transfected with pGFP-GPM6B without (A) or with pNef-DsRed (B) or pDsRed (C) cotransfection are shown. Scale bar: 10 µm.

