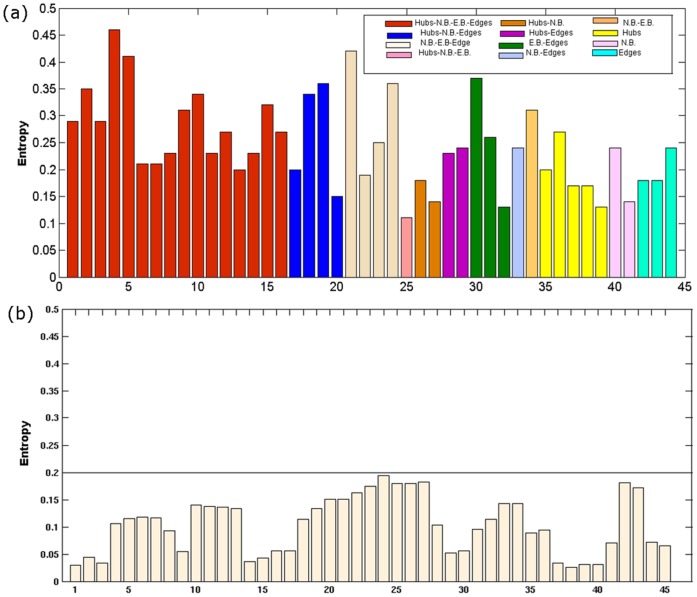
Figure 6. Bar plot of the Shannon entropy (SE) values.
(a) Positions/residues identified as important by any combination of the four network parameters, namely hubs, NB, EB and edges exhibits SE values greater than 0.2, the maximum SE value for the dataset being 0.45 (Fig. S3b in Supporting Figures S1). (b) Positions/residues which belong to the lowest 30 positions in the hub, NB, EB and edge list clearly show SE values less than 0.2. This is a control to emphasize that the residues identified as important by the network parameters also have high SE values.

