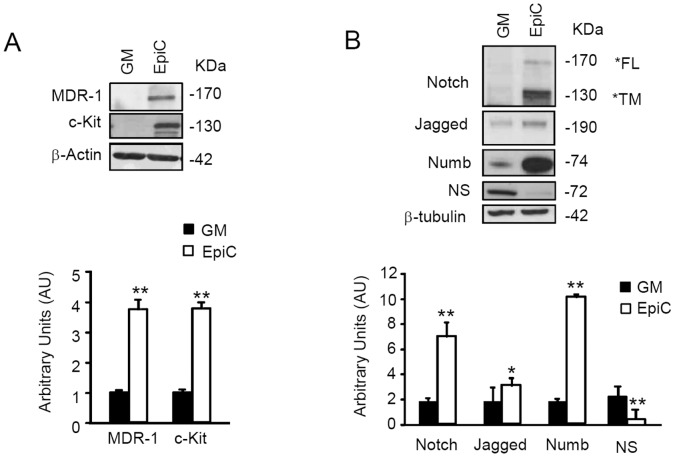
Figure 2. Effect of EpiC treatment on stem cell marker expression.
Western blotting analysis of (A) adult cardiac stem cell marker c-Kit and MDR-1 (n = 4) and (B) Notch, Jagged-1, Numb and nucleostemin (NS) in CStC, grown either in GM or in EpiC (n = 6). Densitometry is shown in the bar graphs at the bottom of each panel (**P≤0.01, *P≤0.05 vs GM). FL = full length protein; TM = Transmembrane domain.

