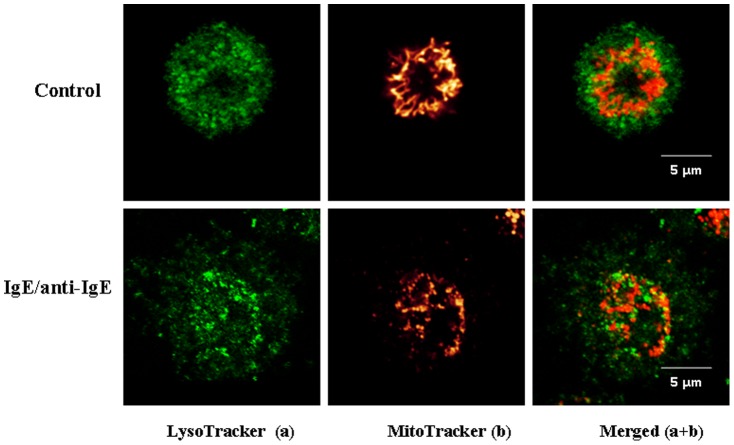
Figure 1. Mast cell degranulation results in extracellular mitochondrial particles translocation.
hCBMCs were stained with MitoTracker Deep Red (20 nM) for 20 min and LysoTracker DND green (50 nM) for 30 min, then seeded in glass bottom culture dishes and observed under Leica TCS SP2 Confocal microscope. Mitochondrial distribution was observed in resting (upper panels) and degranulated (bottom panels) mast cells stimulated as shown. The left panels depict secretory granules in green and the middle panels represent mitochondria fluorescence in red. The right panels represent images merged from the two previous panels.

