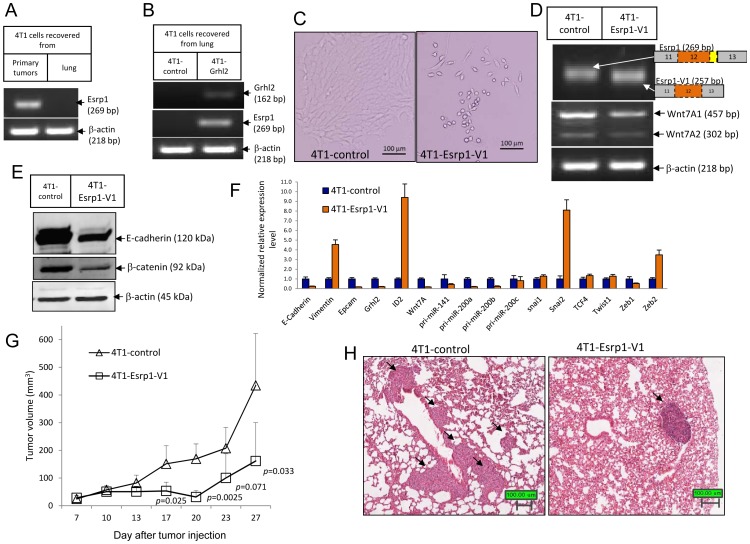
Figure 5. Esrp1 is regulated by Grhl2, and stable-expression of a variant isoform of Esrp1 (Esrp1-V1) leads 4T1 cells to undergo EMT and inhibits tumor progression.
(A) Esrp1 was down-regulated in 4T1 cells recovered from lung. Esrp1 expression in 4T1 cells recovered from primary tumors and lungs was analyzed by RT-PCR. Data represent one of four independent experiments (n = 18). (B) Stable expression of Grhl2 reversed Esrp1 expression in 4T1 cells recovered from lung. Gene expression in 4T1-control and 4T1-Grhl2 cells recovered from lung was analyzed by RT-PCR. Data represent one of four independent experiments (n = 18). (C) Representative micrographs of 4T1-control and 4T1-Esrp1-V1 cells. Stable expression of a variant isoform of Esrp1 (Esrp1-V1) led to transformation of 4T1 cells from cobble-stone like epithelial morphology to spindle-like mesenchymal morphology. Esrp1-V1 was cloned from a cDNA pool derived from 4T1 cells that lacked 12 in frame base pairs compared to the reference sequence of mouse Esrp1 (NM_194055). Esrp1-V1 was introduced into 4T1 cells by lentiviral infection. (D) Validation of Esrp1-V1 expression in 4T1-Esrp1-V1 cells by RT-PCR. On the right are the schematics depicting the gene structures of Esrp1 and Esrp1-V1 based on sequencing results. Esrp1-V1 is 12 base pairs shorter than the dominant transcript of Esrp1 in 4T1 cells due to using an alternative splicing site within exon12, which is why it migrates slightly faster in 2.5% agarose Gels. Expression of Wnt7A1 was down-regulated significantly in 4T1-Esrp1-V1 cells. (E) E-cadherin and β-catenin expression in 4T1-control and 4T1-Esrp1-V1 cells were analyzed by Western blotting. (F) Expression changes of EMT markers in 4T1-Esrp1-V1 cells compared to 4T1-control cells were analyzed by quantitative realtime PCR. Error bars represent the mean ± SEM of duplicate experiments. (G) Growth curves of tumors formed by 4T1-control and 4T1-Esrp1-V1 in wild type BALB/c mice. 6-week-old female BALB/c mice were injected with 4T1-control or 4T1-Esrp1-V1 cells (1.0×10⁵ cells in 100 ul PBS for each mouse; 4T1-control, n = 8 mice; 4T1-Esrp1-V1, n = 9 mice). Tumor size was measured twice weekly. Data represents one of two independent experiments. Each data point represents the mean ± SD of five primary tumors. (H) Lung metastasis was examined by hematoxylin and eosin (HE) staining of paraffin sections of fixed lung tissues (4T1-control, n = 8 mice; 4T1-Esrp1-V1, n = 9 mice). Arrows indicate metastatic tumors.

