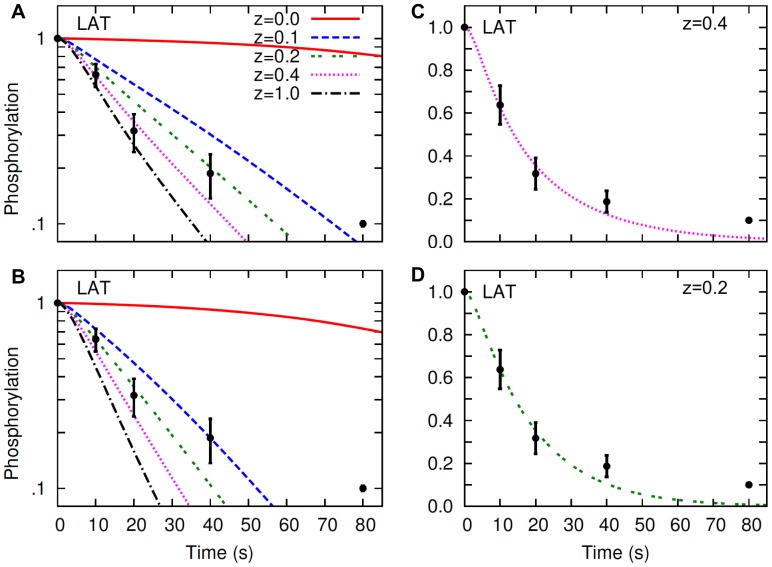
Figure 4. LAT dephosphorylation in the simulated hapten-inhibition experiment.
Lines represent the simulation results, and symbols represent the experimental data of Peirce and Metzger [40]. Different lines in panels A and B represent different levels of raft protection as indicated by the parameter  Experimental data and the line at
  in panel A are re-plotted in linear scale in panel C. Experimental data and the line at
  in panel B are re-plotted in linear scale in panel D. The top and the bottom panels represent different values of the receptor-Syk dissociation constant in the model:
  The value taken from Faeder et al. [41], is used in panels A and C, and
  is used in panels B and D. In simulations, steady-state receptor crossliking is induced with a bivalent ligand concentration of 1 nM, and then monovalent hapten is added at 100 µM (Materials and Methods). Time zero indicates the point when hapten is added. In simulations, default values (Table S1) are used for parameters not shown in the figure.

