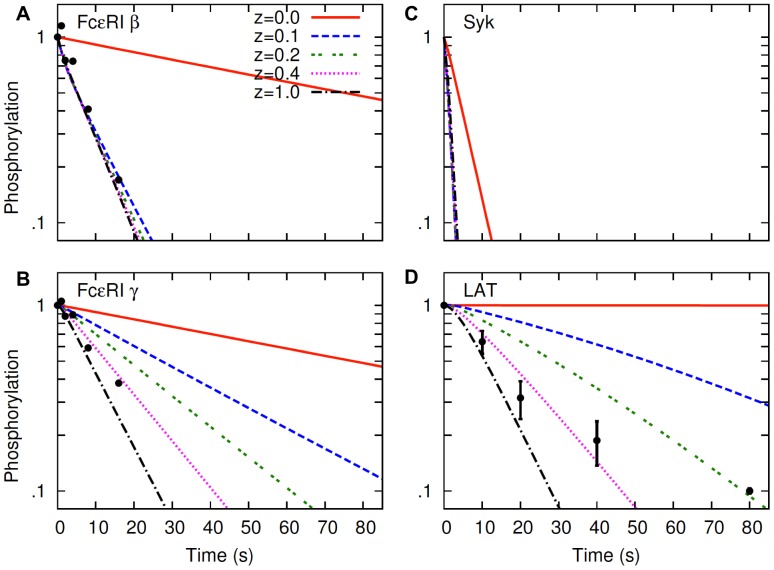
Figure 6. Effects of lipid raft lifetime increase on protein dephosphorylation.
The hapten inhibition experiment is simulated with a mean raft lifetime  s (instead of 10 s, the default value in the model). With this change in
  the lumped parameter
  (Eq (1)) is adjusted to keep the partition coefficients of proteins
 fixed. For other parameters, default values (Table S1) are used. Dephosphorylation kinetics of FcεRI β and γ are shown in panel A and B, respectively. Dephosphorylation kinetics of Syk and LAT are shown in panel C and D, respectively.

