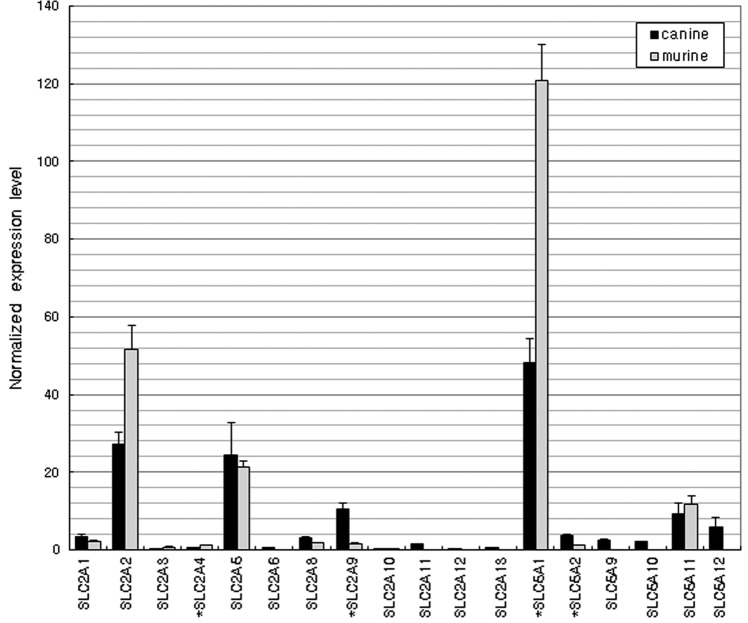
Figure 1.
Comparative gene expression of various glucose transporters in the intestines of dogs and mice (n=4). Expression levels were measured as the intensity of the hybridization signal in a GeneChip array and normalized using GeneSpring 7.2. *>2-fold difference in gene expression between the two species (t-test, P<0.01). SLC2, solute carrier family 2 (GLUTs, facilitated glucose transporters); SLC5, solute carrier family 5 (SGLTs, sodium/glucose cotransporters).

