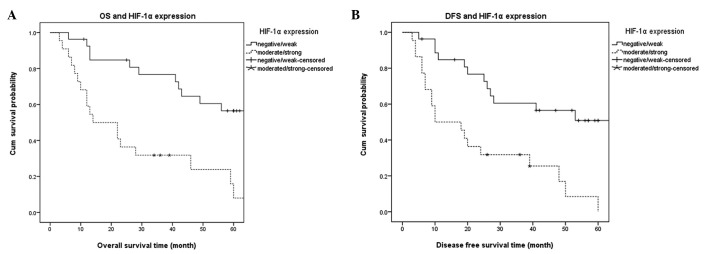
Figure 4.
Survival analysis of HIF-1α overexpression with overall survival (OS) and disease-free survival (DFS) (Kaplan-Meier curve). The survival timetable of all patients was divided into two groups for comparison based on the expression levels of HIF-1α: Negative/weak group and Moderate/strong group. (A) OS curve; (B) DFS curve. HIF-1α, hypoxia-inducible factor-1α.

