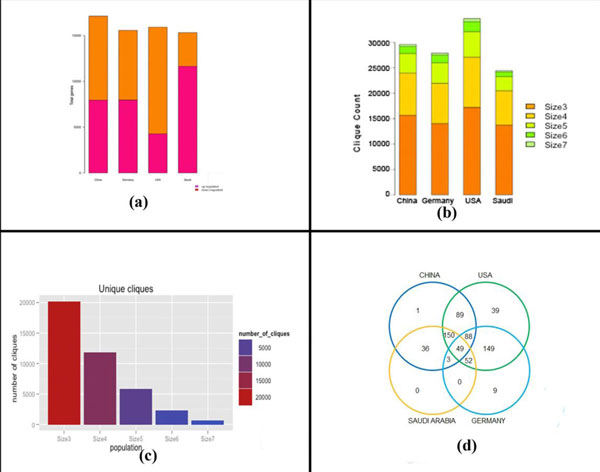
Figure 2.
(a) Gene expression profile for genes satisfying the t-test across populations. SA showed the highest number of up-regulated genes, followed by GER, CHN, and then USA. (b) Clique distribution across population. USA had the highest number of cliques for all the sizes, while SA had the lowest number of cliques. CHN and GER had nearly same number of cliques of all sizes. (c) Total number of unique cliques of respective sizes identified across population. There was a large decrease in size 7 unique cliques identified in all the populations compared to numbers of cliques of other sizes. (d) The number of common cliques identified across all populations was 49. The cliques identified in SA overlapped with all the other populations.

