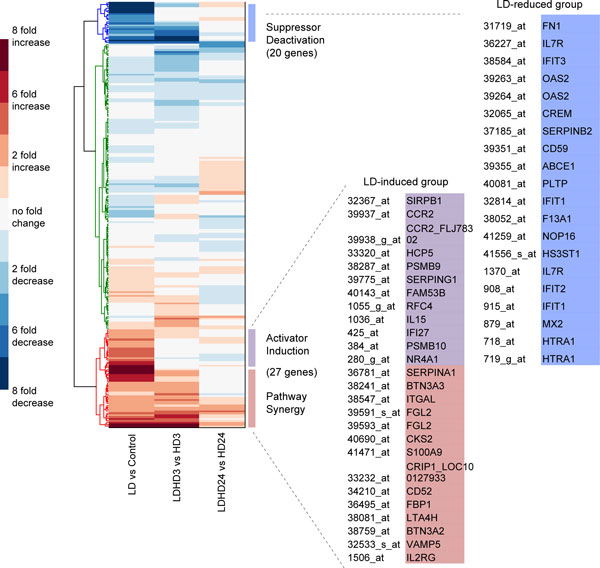
Figure 4.
Analysis of the microarray data (GEO, accession number: GDS1365). Hierarchical clustering of the gene expression profiles over 225 genes. The left, middle and the right columns denote the fold change under LD vs Control, LD+HD vs HD (3 hr), and LD+HD vs HD (24 hr), respectively. Genes that are statistically increased and decreased by LD are listed on the right. These genes are grouped into different priming mechanisms according to the guideline shown in Figure 3.

