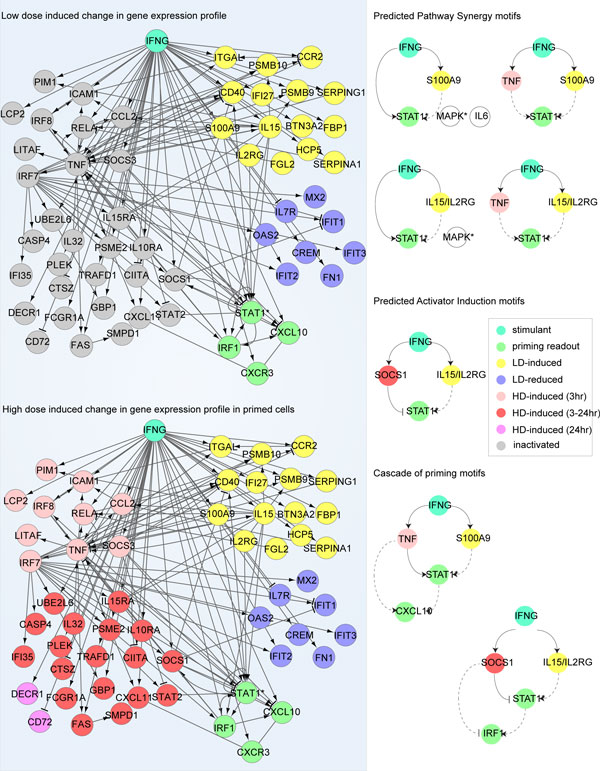
Figure 6.
Construction of the regulatory networks associated with the selected genes using IPA® database. Left panel: The selected groups of genes with different dose-response and dynamics are put into IPA® database to identify signaling and regulatory relationships with the readout molecules (see Methods for details). Right panel: Priming motifs with different priming mechanisms are identified from the network under the guideline shown in Figure 3.

