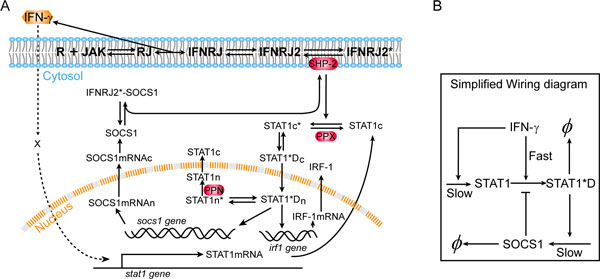
Figure 8.
Wiring diagram of IFN-γ signal transduction. (A) Detailed wiring diagram used in the numerical simulations. IFN-γ binding to the cell membrane embedded Receptor/Jak complex leads to dimerization of the binding complex, and subsequent phosphorylation of Jak molecules; the phosphorylated dimer IFNRJ2* recruits and phosphorylates cytoplasmic STAT1 molecules; the latter dimerize and move into the nucleus, functioning as transcription factor to induce expressions of socs1, irf1, and many other genes; SOCS1 can either bind to Jak and inhibit its activity or compete with STAT1 on binding to IFNRJ2*. IFN-γ also induces Stat1 expression through an unknown mechanism independent of the Jak-STAT canonical pathway. Here we use "X" to represent an undetermined intermediate. For the molecular species, "c" and "n" refer to cytoplasm and nucleus, respectively; "*" refers to phosphorylation. This diagram is adapted from [31]. (B) A simplified wiring diagram to emphasize the three key processes with different time scales contributing to the priming effect.

