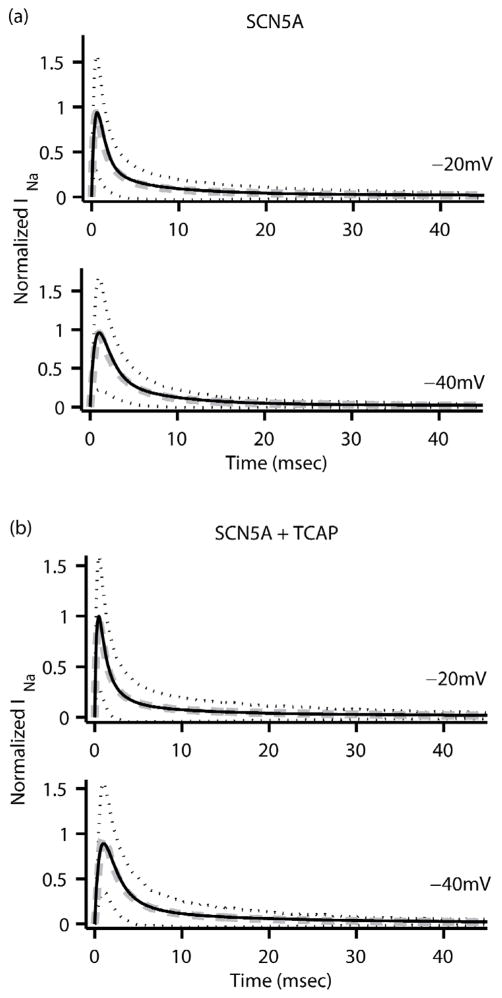
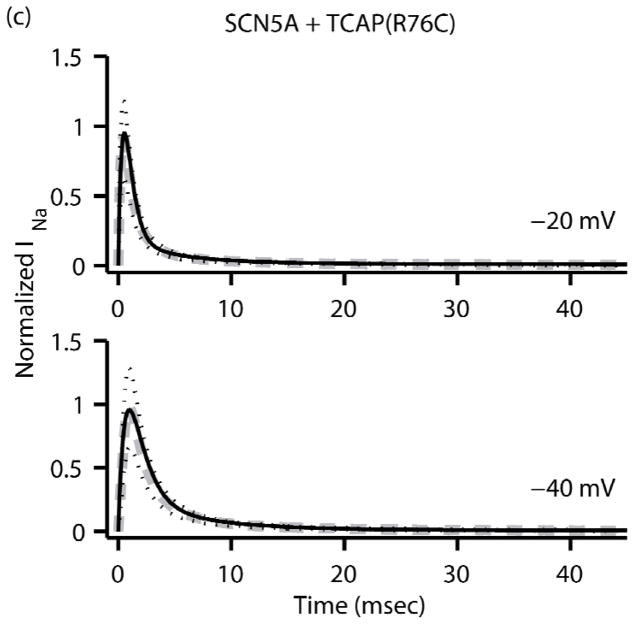
FIGURE 3.
Normalized INa (black solid line) as a function of time from the three Markov sodium channel models (a) SCN5A, (b) TCAP and (c) R76C at clamping voltages of −20mV (top) and −40 mV (bottom). The corresponding average experimental data (dashed grey line) is also plotted along with black dotted lines representing ± one standard deviation for the experimental data.


