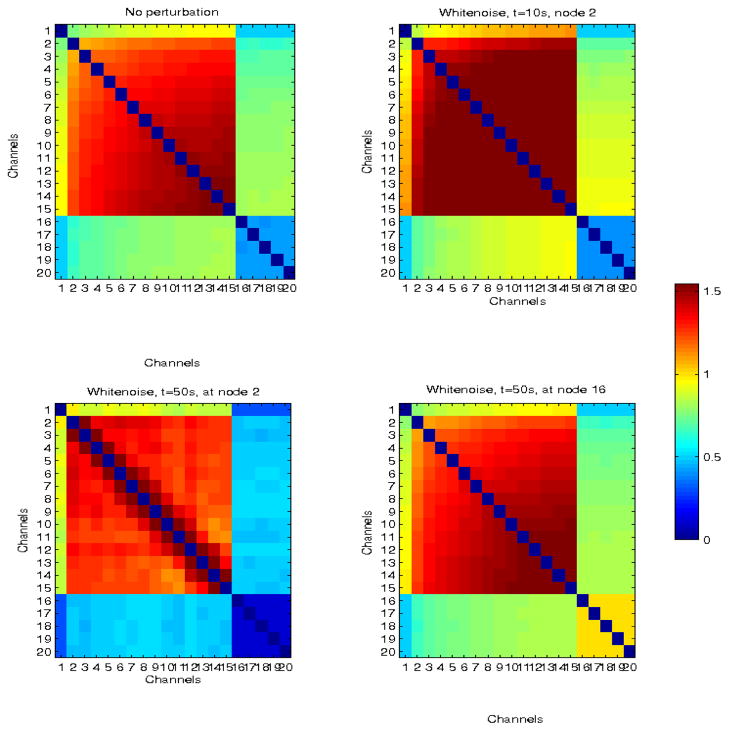
Fig. 10.
Simulated larger network with delayed neural propagation from nodes 1 to 15 (top left panel). The top right panel corresponds to the network response to white noise perturbation at node 2, at time t = 5 s. Bottom left and right panels correspond to perturbations at times t = 50s also at node 2, and at t = 50 s at node 16 (outside the sub-network involved in propagation).

