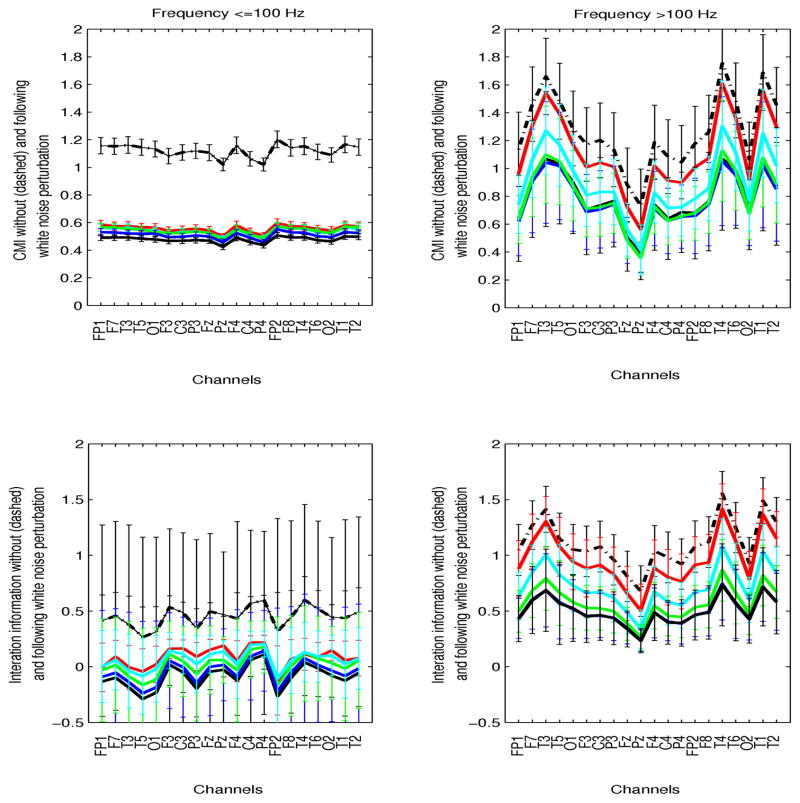
Fig. 7.
Mean conditional (CMI, top plots) and interaction (II, bottom plots) ictal information as a function of channels, at frequencies ≤100 Hz (left plots) and >100 Hz (right plots) is shown. Inter-patient variability is superimposed to averaged parameters over patients. Values prior to noise perturbation (black dashed line), and following addition of white noise with amplitudes 10% (red), 50% (cyan), 100% (green), 200% (blue), 400% (black) the amplitude of the EEG are superimposed.

