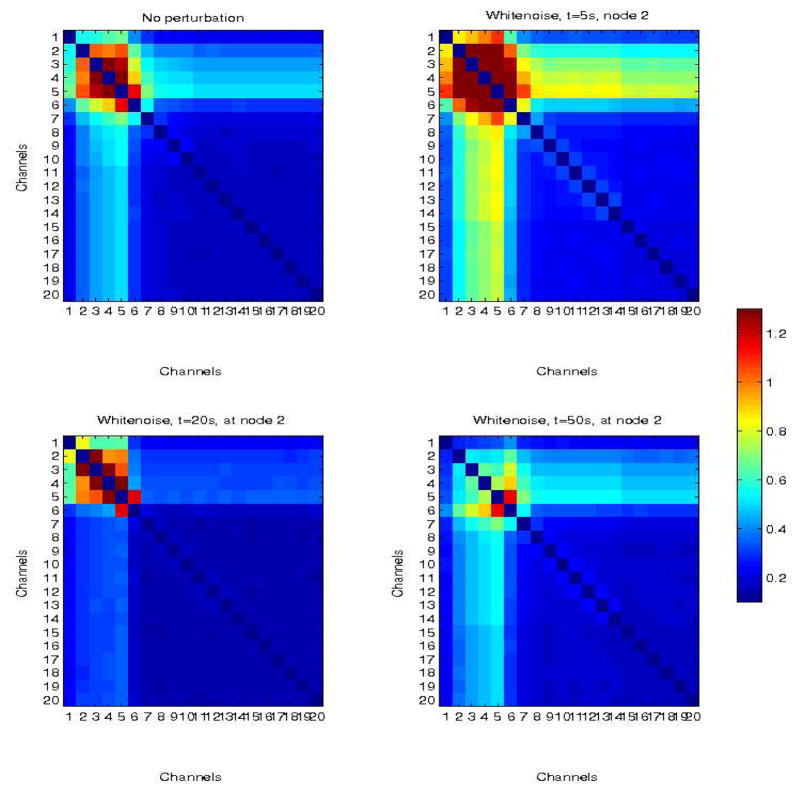
Fig. 9.
Simulated network in which propagation is limited to nodes 1–5 (top left panel). There is also limited propagation in adjacent nodes (6,7) due to connectivity between nodes 5–6 and 6–7, but the remaining nodes are only weakly coupled (the baseline), with CMI≤0.3. Top right panel corresponds to the network response to a white noise perturbation at node 2, at time t=5s from the beginning of the simulation. Bottom left and right panels correspond to perturbations at times t = 20 s and t = 50 s, respectively.

