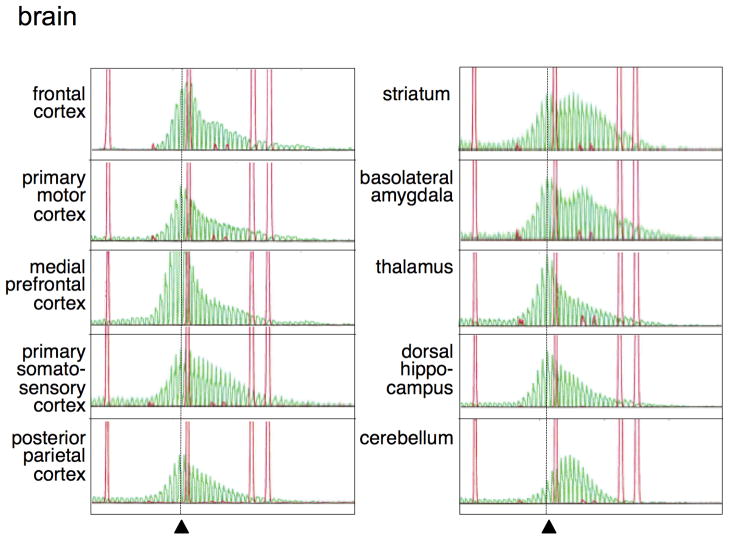
Fig. 2. Regional variation in the repeat profiles in the brain of a FX PM mouse.
A ROX500 molecular weight marker was used for all samples. The dotted line indicates the mobility of the original allele as assessed from the tail DNA taken at weaning. GeneMapper profiles for the FX repeat were obtained from different regions of the brain of a 12 month old PM male mouse with ~131 repeats. Similar profiles were seen in two other mice that were tested.

