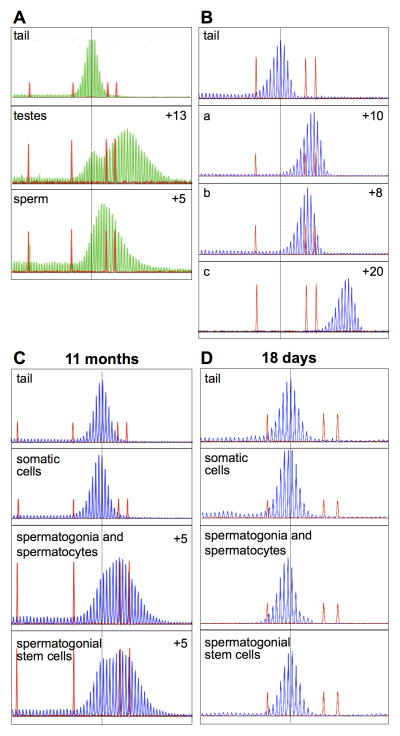
Fig. 3. Cell-specific and age related expansion in the testes.
The dotted line in each panel represents the original allele size (~140 repeats) based on the tail DNA at 3 weeks of age in the case of the data shown in Panels A, B and C and 18 days in the case of the data shown in Panel D. The repeat profile in Panel A was obtained with a HEX-labeled primer and the repeat profiles shown in B, C and D were obtained using a FAM-labeled primer. The choice of primer label does not affect the repeat profile. The numbers in panel A, B and C refer to the number of repeats added to the major allele in the population relative to the repeats present in the original allele. A) Comparison of the repeat number in tail DNA taken at weaning and in total testes DNA and sperm DNA from a 12 month old animal. B) Comparison of the repeat number in tail taken at weaning with the repeat number in the products of 3 independent small pool PCRs (labeled a, b and c) carried out on the sperm of the same animal at 12 months of age. C) and D) Comparison of the repeat profile in the tail DNA taken at weaning and in the fractions enriched for the indicated cell type in the testes of mice at 11 months (C) and 18 days (D).

