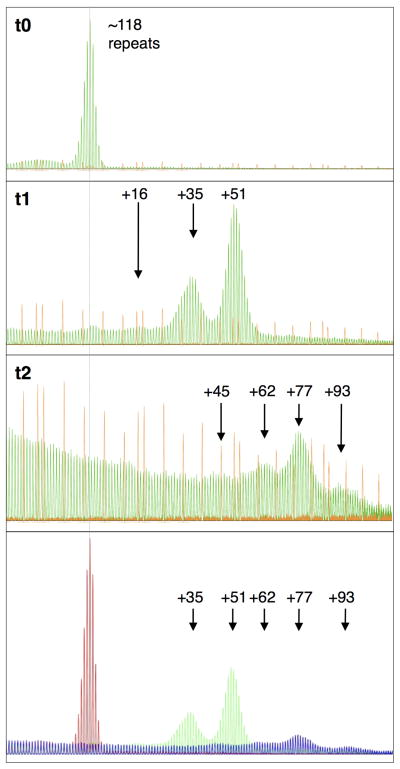
Fig. 5. Somatic expansions in a human PM lymphoblastoid cell line.
GeneMapper profiles for the PM repeat obtained for the GM06891 lymphoblastoid cell line after intermittent growth in tissue culture. Three different samples are shown, t0, corresponding to the DNA isolated from cells when they were first obtained from the cell repository, and samples t1 and t2 that were isolated at 2 later time points. In all 3 samples the same amount of LIZ1200 standard was used. However because of the poor PCR yield of the sample at t2, a phenomenon typical of amplification through long repeat tracts, this data is shown on an expanded scale. The last panel shows the repeat profiles from all three time points superimposed on one another with the red profile representing the original allele and the green and blue profiles corresponding to samples t1 and t2. The data in this panel are all shown on the same scale. The dotted line indicates the size of the original allele. The numbers associated with each peak indicates the number of repeats added from the original allele at t0.

