
Fig. 6. Expansions differ in different regions of the brain of a FXTAS patient with 91 repeats.
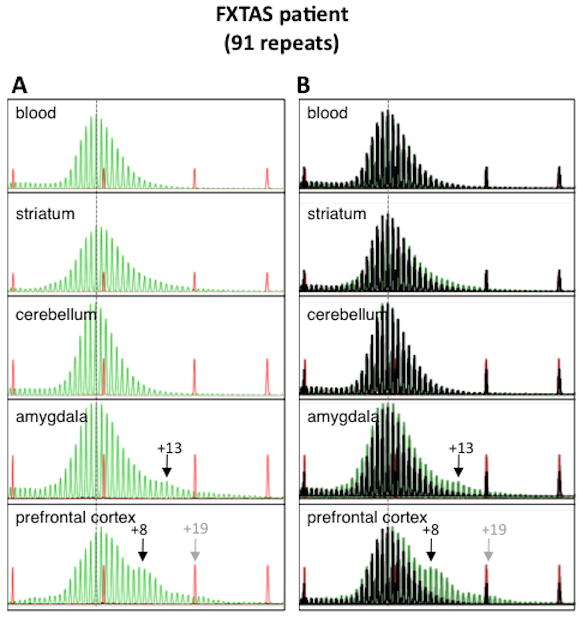
A) GeneMapper profiles from different brain regions of this patient compared to the profile seen in DNA isolated from blood isolated at the time of diagnosis 6 years before death. B) Repeat profiles for different brain regions superimposed with the repeat profile from heart shown in black. The numbers refer to the number of repeats added relative to the major allele in blood. This profile was reproducible and all peaks were seen with a range of different DNA concentrations.