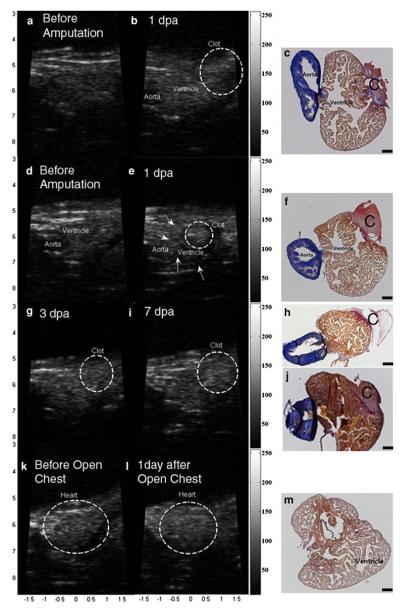
FIGURE 11.
PI-CTHI UBM images of zebrafish (a) before amputation, (b) 1 dpa, and (c) the corresponding histology. Images are acquired from another zebrafish (d) before amputation, (e) 1 dpa with (f) its histology. The same set of images is also taken at 3 dpa ((g) and (h)) and 7 dpa ((i) and (j)). Images of sham zebrafish are displayed (k) before open-chest, (l) 1 day after open-chest, and (m) for the histology. In each histology image, clot is marked with ‘C’ and the black scale bar indicates 100 μm.

