FIGURE 12.

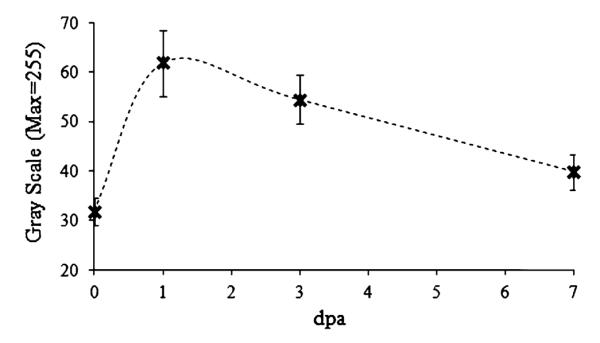
Longitudinal study of changes in mean echo intensity from the clots from 1 to 7 dpa. Error bars indicates standard deviation between 5 fish for the experiment.

Longitudinal study of changes in mean echo intensity from the clots from 1 to 7 dpa. Error bars indicates standard deviation between 5 fish for the experiment.