FIGURE 8.

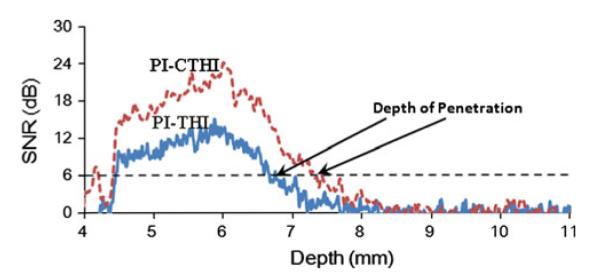
Comparison of eSNR distributions along the depth for PI-CTHI (a red dashed line) and PI-THI (a blue solid line). The depth of penetration for each method is indicated by a solid arrow.

Comparison of eSNR distributions along the depth for PI-CTHI (a red dashed line) and PI-THI (a blue solid line). The depth of penetration for each method is indicated by a solid arrow.