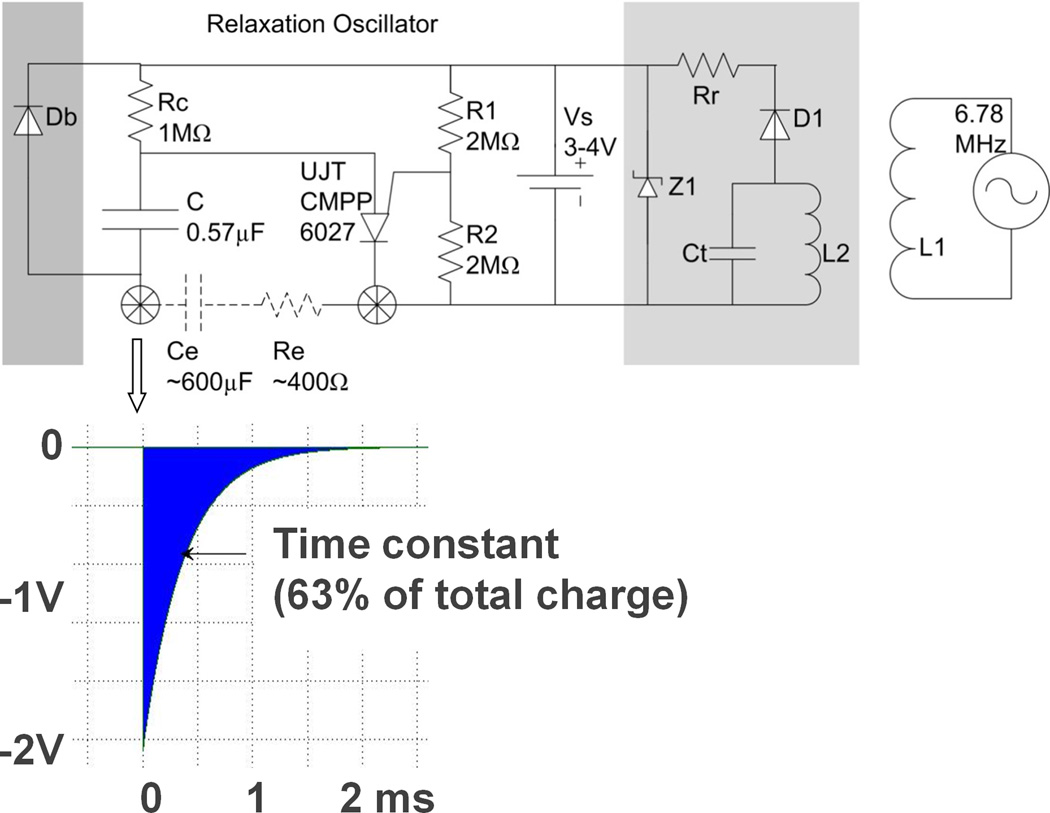
Figure 4.
Schematic diagram of relaxation oscillator (center top) with typical output pulse (insert below), with optional bypass diode Db for recharging through electrodes (dark grey box on left) and optional recharging circuitry (light grey box at right) for transcutaneous inductive recharging from external coil L1. See text for description of individual components. Insert below shows typical exponential cathodal pulse from corkscrew Ir electrode (open arrow) with typical values for Ce after activation and Re in myocardium.

