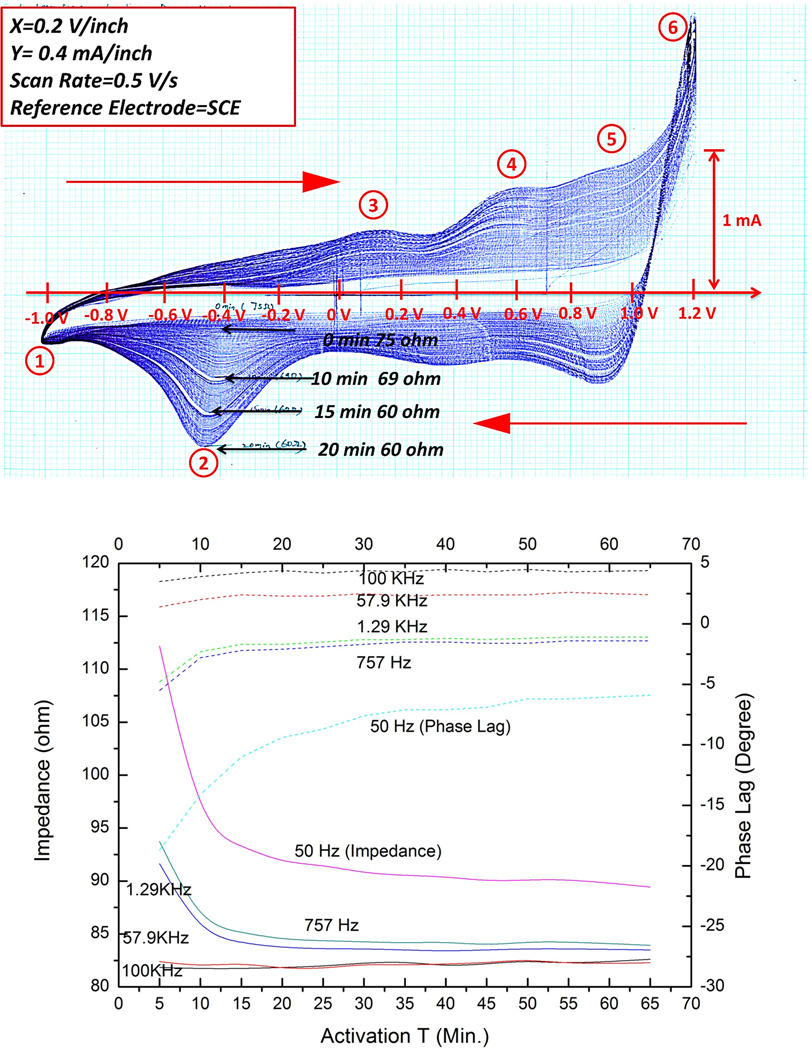
Figure 6.
Top: typical cyclic voltammetry curves (current on abscissa vs. applied voltage with respect to saturated calomel electrode in phosphate buffered physiological saline) for ±0.5V/s ramp between cathodal (1) and anodal (6) electrolysis points showing progressively larger enclosed charge; Bottom: impedance (solid lines, left ordinate) and phase (dotted lines, right ordinate) for various sinusoidal frequencies as a function of activation time (abscissa, minutes) for 1.3mm diameter Ir corkscrew electrode with 4 coils (2mm) exposed length in saline.

