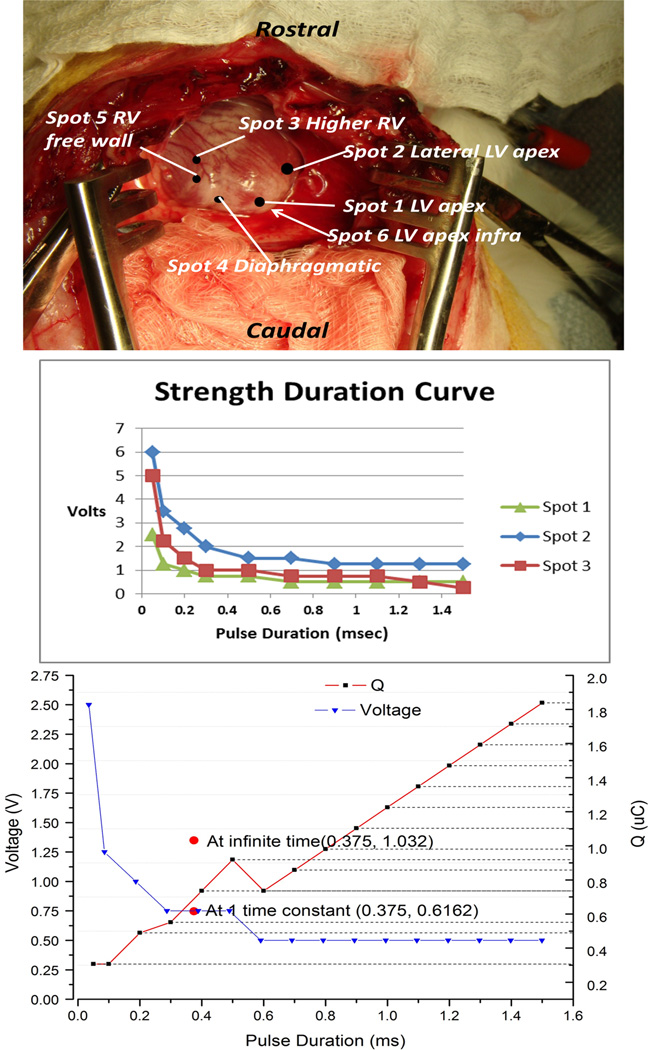
Figure 8.
Top: insertion locations for data in Table 1; Middle: threshold strength-duration curves for square-wave stimuli; Bottom: Comparison of threshold charge (red lines; right ordinate) vs. pulse duration for square waves (black dots) and exponential pulses from relaxation oscillator (vertical red bar at time constant = 0.375ms) for pacing at Spot #1.

