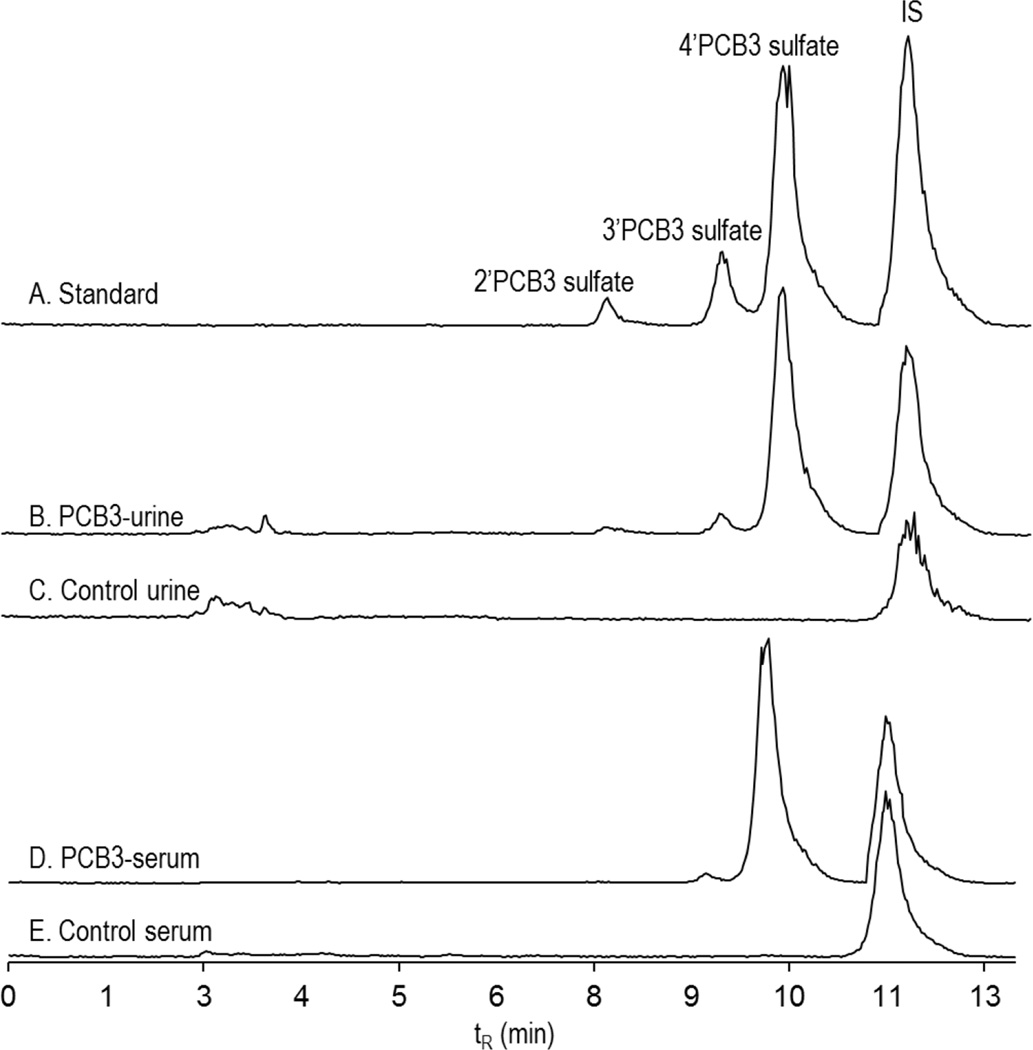
Figure 5. Chromatograms showing PCB3 sulfate standard and their peak correspondence in urine and serum.
Chromatograms of 2’ PCB3 sulfate, 3’PCB3 sulfate, 4’PCB3 sulfate, and IS in concentration of 0.05, 0.1, o.5 and 0.5 µg/mL (A), urine from PCB3 treated rats after four hours of exposure (B), urine from control animal (C), serum from PCB3 treated rats (D), and serum from control rats (E). MS analysis was carried out Waters Acquity TQD.

