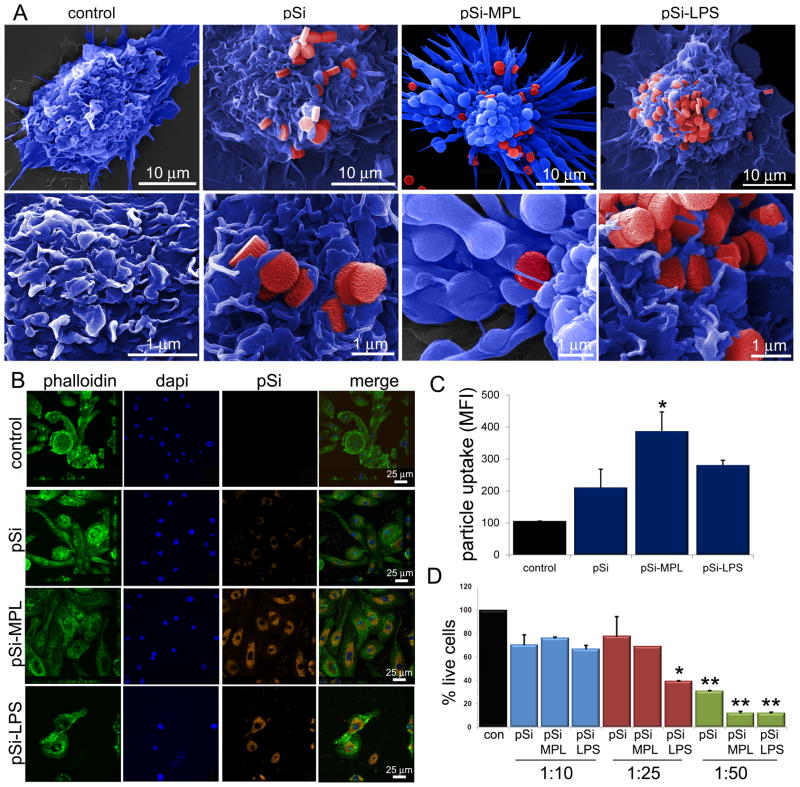
Figure 3. Impact of microparticle-bound TLR ligand on cellular uptake and apoptosis.
A) Pseudo-colored scanning electron micrographs show control and MPL- or LPS-microparticle stimulated BMDC 1–3 hr following the introduction of microparticles (top: 8kx mag, bar 10 μm; bottom: 25kx mag; bar 1 μm). B) Confocal images show BMDC labeled with Oregon Green® 488 Phalloidin, DAPI, and incubated with Wheat Germ Agluttinin Alexa Fluor® 594 and TLR ligand-conjugated microparticles for 3 hr. C) Microparticle uptake by BMDC is shown for each population based on the average intensity of particle signal relative to DAPI signal for various ROIs (*p<0.00002). D) Flow cytometry was used to determine the percentage of live BMDC (annexin V−PI−) relative to a non-treatment control following a 24 hr incubation with control or TLR ligand-bound microparticles. Microparticles were introduced at ratios of one cell to every 10, 25 and 50 microparticles (*p<0005, **p<0.03; relative to low dose control microparticles).

