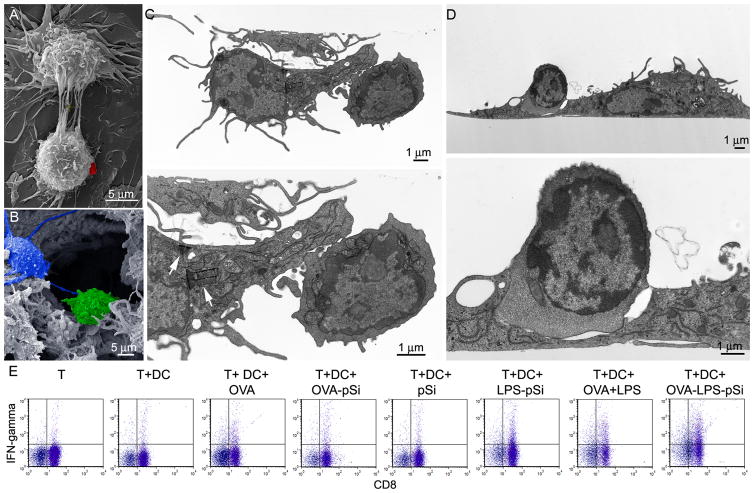
Figure 8. Cellular interactions among immune cells.
A) SE micrograph showing in vitro cell-to-cell interactions (i.e. Tunneling NanoTubes) between adjacent dendritic cells after treatment with microparticles (left; a silicon microparticle is pseudo-colored red; 8400x mag; 15 kV; bar 5 μm). B) SE micrograph showing in vivo cell-to-cell communication by means of pseudopods in a lymphocyte-rich region of the inguinal lymph node (DC pseudo-colored in blue and a lymphocyte in green (5800x mag; 8 keV; bar 5 μm). C–D) TE micrographs show two OVA peptide, LPS-microparticle primed BMDC (C57BL/6; 3 hr) and adjacent OT-1 transgenic T cells following 1 hr of co-culture at two magnification levels (1200x and 4000x mag; bars 1 μm). C) Arrows indicate the presence of 4 intracellular silicon microparticles in the BMDC. D) An immunological synapse is seen in the enlarged (bottom) image. E) Flow cytometry analysis of intracellular IFN-γ levels in OT-1 CD8+ T cells following stimulation of C57BL/6 BMDC with free or microparticle-presented OVA peptide and LPS BMDC for 4 hr.

