Abstract
Both the availability of methods to manipulate genes and the completion of the mouse genome sequence have led to the generation of thousands of genetically modified mouse lines that provide a new platform for studying mammalian development and developmental diseases. Phenotyping of mouse embryos has traditionally been performed on fixed embryos by the use of ex vivo histological, optical and high-resolution MRI techniques. Although potentially powerful, longitudinal imaging of individual animals is difficult or impossible with conventional optical methods due to the inaccessibility of mouse embryos inside the maternal uterus. To address this problem we present a method of imaging the mouse embryo from stages as early as embryonic date (E) 10.5, close to the onset of organogenesis in most physiological systems. This method uses a self-gated MRI protocol combined with image registration to obtain whole-embryo high resolution (100 μm isotropic) three-dimensional images. Using this approach, we demonstrate high-contrast in the cerebral vasculature, limbs, spine and central nervous system without the use of contrast agents. These results indicate the potential of MRI for longitudinal imaging of developing mouse embryos, in utero, and for future applications in analyzing mutant mouse phenotypes.
Keywords: mouse embryo, in utero imaging, cerebral vasculature, CNS, brain ventricles
INTRODUCTION
One of the most exciting achievements in modern biology has been the sequencing of whole genomes in critical model organisms, including the mouse. With the sequencing of the mouse genome (1), an ambitious effort is now underway to produce gene-knockout mice for each of the approximately 23,000 mouse genes (2). The study of these genetically-engineered mice promises to bring new insights into the genetic control of mammalian development and the role of altered development in a wide spectrum of human developmental diseases. While genetic studies can help elucidate the molecular mechanisms underpinning the development of the major organ systems, understanding the morphological changes that are regulated by the genes requires the use of imaging at multiple stages of development or disease progression (3).
Advances in imaging modalities together with the development of automated image processing and analysis algorithms facilitate the efficient measurement of the significance of differences between wild-type and genetically-engineered mice. Compared to physiological assays, normally limited to a few tens of measurements, imaging experiments often provide full coverage of the embryo and consist of millions of independent voxel measurements that can reveal the simultaneous existence of multiple morphological phenotypes as may occur in genetically-engineered mice (4). For many years, whole mount and histology methods have been used to examine mouse embryo morphology. With thin histological sections, in particular, one can use any of a multitude of immunostains to reveal protein expression patterns (5). However, the two-dimensional (2D) nature of the image results produces distortion artifacts when reconstructing three-dimensional (3D) structures such as the vascular network.
The use of MRI, an inherently 3D imaging modality, in mouse developmental biology dates back to the pioneering works of Smith and Johnson (6). Their general approach of preparing fixed embryo samples and imaging over long times (up to 24h) to acquire ex vivo volumetric MRI data at high-resolution (20 μm) continues to be used today, for example to study vascular phenotypes (7,8). Ex vivo MRI has also been used to produce highly detailed 3D anatomical atlases of mouse embryos (9–11). Other than conventional T1 and T2 contrast MRI, diffusion tensor imaging (DTI) has also been used successfully to delineate the anatomy of the central nervous system (CNS) of fixed mouse embryos (12).
While ex vivo imaging of mouse embryos has provided highly detailed atlases of embryonic development of wild type and mutant mice, these techniques portray only snapshots of developmental or pathological progression. In addition, many mutants are difficult to breed, which makes the ability to keep the mouse for subsequent studies important. In mouse imaging, as in the clinical setting, ultrasound is the primary method for visualizing living embryos. Ultrasound biomicroscopy (UBM), a high-frequency ultrasound imaging technique, enables real-time anatomical and functional imaging of mouse cardiovascular and brain development (13,14). However, UBM has limitations in penetration, especially for late-stage embryonic brain imaging, and has limited soft tissue contrast making 3D segmentation and analysis difficult.
In utero MRI has been performed for over a decade (15–19), but only recently have high-resolution images of living mouse embryos been demonstrated. High-resolution 3D MRI studies often require long acquisition times (~ 2h) and are susceptible to image artifacts arising from both maternal and embryonic sources of motion. The most commonly employed technique for imaging of periodic motions (i.e respiration, cardiac), is prospective gating. We reported very high-resolution (100 μm isotropic) images of the CNS of mouse embryos as early as E12.5 by combining manganese-enhanced MRI with respiratory gating (20). Alternative ways of detecting periodic motions have been proposed with the introduction of self-gated (SG) pulse sequences by Larson and co-workers (21). These methods have been employed to generate artifact-free images in both human (22) and mouse studies (23) without the use of any external devices. We used a SG gradient echo (GRE) sequence to acquire in utero images of E17.5 mouse embryos, demonstrating embryonic cardiac imaging at 130 μm isotropic resolution (24) and improved-resolution (115 μm isotropic) in utero analysis of vascular phenotypes in E17.5 Gli2 knockout mice (25).
In the work presented here, we acquired – longitudinally in the same pregnant mice at three embryonic development stages (E10.5, E12.5 and E14.5) – high-resolution (100 μm isotropic) 3D images of mouse embryos in utero. The study aimed to reconstruct detailed anatomical embryo images, capable of capturing information on multiple organ systems during in utero development. The noninvasive embryo imaging methods presented here are therefore well-suited to future longitudinal studies of normal and mutant mouse embryos.
MATERIALS AND METHODS
Animals
All procedures involving mice were approved by the Institutional Animal Care and Use Committee at New York University School of Medicine. We used 6–8 week old timed-pregnant ICR strain mice (Taconic Farms, Germantown NY) where the stage was denoted as the embryonic day (E) following overnight mating (E0.5 was defined as noon of the day that a vaginal plug was detected). For imaging, mice were anesthetized via vaporizer/anesthesia installation (VMC Matrix, Orchard County, NY, USA) with isoflurane gas: 5% isoflurane in air for induction followed by 0.5%–1.5% isoflurane in air via nosecone for maintenance. The body temperature of the mouse was maintained close to 37°C by blowing warm air. Five timed-pregnant animals were each imaged longitudinally at embryonic stages E10.5, E12.5, and E14.5. In addition, one more animal was imaged at stage E10.5 only, and two more at E14.5. The total number of animals imaged (N) at each stage is summarised in Table 1. In each session one embryo was imaged per litter.
Table 1.
Image acquisition parameters at different embryonic stages. All parameters are for a 3D GRE sequence with gradient spoiling on the readout axis, and refocused phase encode axes (but without RF spoiling).
| Embryonic stage | E10.5 | E12.5 | E14.5 |
|---|---|---|---|
| N (mice imaged) | 6 | 5 | 7 |
| Flip angle (°) | 20 | 20 | 20 |
| TR (ms) | 50 | 50 | 50 |
| TE (ms) | 20 | 20 | 20 |
| Acquisition matrix (min) | 100 × 100 × 70 | 120 × 100 × 70 | 130 × 100 × 90 |
| Acquisition matrix (max) | 150 × 126 × 70 | 130 × 100 × 90 | 150 × 110 × 100 |
| FOV (mm, min) | 10.0 × 10.0 × 7.0 | 12.0 × 10.0 × 7.0 | 13.0 × 10.0 × 9.0 |
| FOV (mm, max) | 15.0 × 12.6 × 7.0 | 13.0 × 10.0 × 9.0 | 15.0 × 11.0 × 10.0 |
| NVOL (min - max) | 16 – 24 | 12 – 24 | 12 – 20 |
| Resolution (μm) | 100 × 100 × 100 | 100 × 100 × 100 | 100 × 100 × 100 |
| TTOTAL (h, min) | 1.5 | 1.9 | 1.9 |
| TTOTAL (h, max) | 3.3 | 3.3 | 3.2 |
| TTOTAL (h, mean ± SD) | 2.2 ± 0.7 | 2.5 ± 0.5 | 2.6 ± 0.6 |
Data Acquisition
We conducted all imaging experiments on a 7T magnet (Magnex Scientific Ltd., Yarnton, UK) interfaced to a Bruker Biospec Avance II console (Bruker BioSpin MRI, Billerica MA) and actively-shielded gradients (BGA9-S; Bruker), and acquired images using a quadrature receive-only surface coil (Bruker) and a quadrature transmission volume coil (72 –mm ID, Bruker) that were actively decoupled through a pin-diode. We employed a 3D SG-GRE sequence, similar to that described in our previous report (24). Briefly, the method comprised a modified gradient-spoiled 3D GRE sequence with gradient-refocusing on both phase encode axes and a large constant spoiling gradient on the read axis (and no radiofrequency spoiling). A gating signal was acquired after the slab-refocusing gradient and during the ramp of the dephasing read gradient, but prior to any phase encoding of the signal. Changes in this gating signal were used for retrospective respiratory gating. In our implementation, a standard linear raster was employed to cover k-space, where the two phase-encoding gradients were incremented linearly from their maximum negative to their maximum positive values. After the acquisition of a full 3D image, the whole process was repeated until NVOL repeated images were acquired (see Table 1). In this way, all collected data were stored, and then image reconstruction was performed off-line, including retrospective motion gating and image registration as described in the next section.
Acquisition Parameters
We first selected image acquisition parameters that produced contrast throughout the stages of developmental examined. Previously, we showed that even at very short echo times (< 6 ms) the short T2* of the deoxygenated fetal blood allows the visualization of cerebral vasculature at late (E17.5) embryonic stages (25). However, images acquired with short echo times did not show obvious contrast between blood vessels and surrounding tissue at early (E10.5) stage. In the case of E10.5 embryos, we observed good contrast between vascular and non-vascular structures at a TE of 20 ms, and we used this echo time for imaging at all embryonic stages here. Repetition time (TR) and flip angle were 50 ms and 20° respectively.
To minimize image artifacts caused by embryonic displacement, it is necessary to acquire the repeated 3D image volumes as rapidly as possible. To achieve this for a given resolution, we adapted the field-of-view (FOV) during each scan session to be the minimum that could be achieved (i.e., with the least number of phase-encoding steps) while ensuring that no wrap-around artifacts would occur in the volume of interest. This meant that the acquisition matrix tended to increase with embryonic stage to accommodate for increasing embryo size. The sampling bandwidth (BW) was also increased with matrix size, resulting in images of similar spectral resolution (~ 300 Hz/pixel) at all embryonic stages. The total acquisition time at every stage was kept between 2 and 3 h, which we previously found was well tolerated by the mice, by adjusting the number of repeated image acquisitions (NVOL). A summary of experimental parameters is provided in Table 1.
Data Processing and Image Reconstruction
SG data were post processed to produce scalar data representative of the respiratory state at each TR of the image acquisition. Respiratory traces were produced from the sum of the magnitude of the acquired data. For gated reconstruction, a threshold (typically excluding 20% of the acquired data) was selected to determine which acquisitions were affected by respiratory motion. Each of the serially acquired images was registered to eliminate shifts in the embryo position over the course of the scan. For this purpose, a six-parameter registration was performed using software produced by the Montreal Neurological Institute (MNI_AutoReg) (26). A coarse manually drawn mask covering the entire embryo was used for each registration. Image-space translation and rotation parameters from the six-parameter transforms were used to compute equivalent k-space transformations. Translations were transformed to linear phase ramps that were multiplied with k-space data. Rotations were applied without alteration. The resulting transformed k-space lines were averaged together after discarding lines affected by maternal respiration. To highlight vasculature, image contrast was inverted and maximum intensity projections (MIPs) were created.
Simulation of the Effect of Maternal Respiration on Image Quality
In our application of the SG sequence, k-space lines that are affected by maternal respiration are excluded from the final reconstruction. However, intermediate images used for registration retain corrupted data (or use zero lines) and exhibit artifacts. The extent of artifact depends primarily on the number of affected (or excluded) k-space lines and the position of those lines (with k-space lines closer to the center affecting the quality of the reconstructed image more compared to those at the periphery of k-space). These artifacts can affect both the results of the registration process and consequently the quality of the final averaged image.
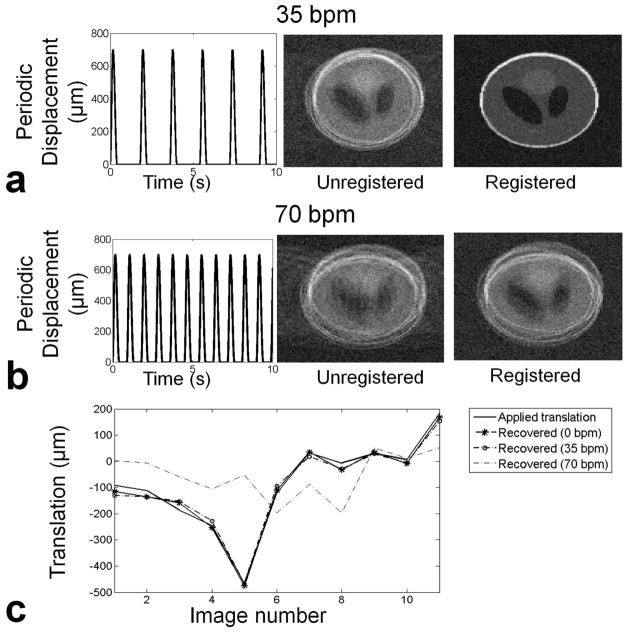
To understand the limitations of our method to reconstruct accurate embryonic images during maternal respiration, we performed simulations on a 3D Shepp-Logan phantom (27) with matrix size typical of an E14.5 embryo (i.e., 150 × 100 × 100 as shown in Table 1) and taking NVOL=12. We applied random rigid body transformations to all but the first image to simulate random motion of the embryo. We added zero mean complex Gaussian noise to all twelve images so that each image had a signal-to-noise ratio of 5 in the image domain. We then simulated embryo motion due to maternal respiration as in the work described by Segars et al. (28), assuming a maximum (periodic) displacement of 700 μm and randomization of the respiratory phase between image volumes. We replaced k-space lines from our digital phantom with zeros whenever the displacement was more than half the voxel size (i.e. 50 μm).
We examined three cases of respiration: a theoretical reference case with no respiratory motion and zero breaths per minute (bpm); a typical respiration rate for our mouse experiments (35 bpm); and a higher than expected respiration rate (70 bpm). For each case, we repeated the simulation 100 times and compared the translations and rotations recovered by the registration algorithm with the ones we applied. We also reconstructed images to evaluate the effect of the registration results on the final image.
RESULTS
Simulations of the effect of maternal respiration on image quality
In Figure 1 we show the results of the simulations for the effects of maternal respiration on the quality of the reconstructed images and the success of the image registration in recovering embryo motion. In Fig. 1a a typical respiration rate of 35 bpm is considered, resulting in exclusion of 18.5% of the acquired data due to respiration. A typical example of an average image result after discarding respiration affected data is shown in the middle column. The registration algorithm was able to recover the translations and rotations quite accurately (Fig. 1c) and produced an image of improved quality after correction for embryo motion (Fig. 1a, right). At a fast respiration rate (70 bpm, Fig. 1b), with 37% of k-space lines excluded, the registration algorithm cannot recover the spatial transformations simulated in these images, and hence the image quality after attempted correction of registration was low (Fig. 1b, right). In Fig. 1c we show the recovered translations in both the typical and fast respiration rate cases, as compared to the applied translations for Figs 1a-b. With no motion (0 bpm), the algorithm recovers most of the applied displacement, resulting in a root mean square error (RMSE) over 100 simulations of 45 ± 28 μm (RMSE ± SD; i.e., smaller than a voxel). At 35 bpm, most of the displacement was still recovered with RMSE of the recovered displacement at 124 ± 45 μm, while at 70 bpm the performance of the registration process was very poor with RMSE at 610 ± 450 μm.
Fig. 1.
Simulation of error propagation due to data exclusion and registration inaccuracies. a) Simulated periodic displacement of the abdomen during maternal respiration at 35 bpm (left). Typical reconstructed image after rigid body transformations and exclusion of 18.5% of k-space lines contaminated by breathing (middle). The final image was recovered with registration (right). b) At 70 bpm the exclusion of 37% of k-space results in artifacts in the phase encoding direction. The registered image still shows artifacts and inaccuracies. c) The applied translations can be recovered accurately at 0 bpm and 35 pbm. At 70 bpm registration errors are superimposed on the aliasing artefacts due to undersampling.
Image results with self-gating and registration for motion compensation
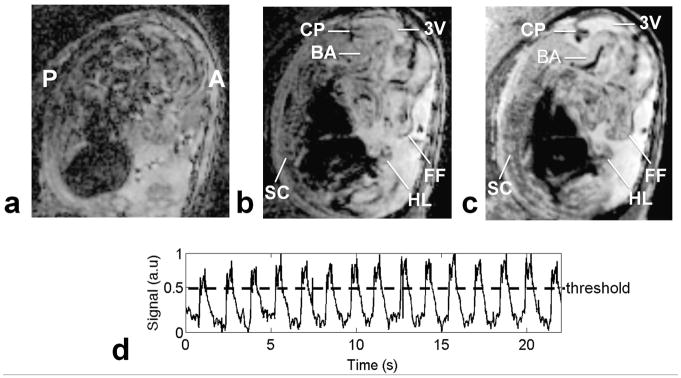
Figure 2 shows a typical example of an acquired image of an E14.5 embryo. When reconstructed by simply averaging all the acquired data, images suffered from obvious artifacts (Fig. 2a). After exclusion of k-space lines contaminated by maternal respiratory motion (as determined from our self-gating data), we achieved a much improved image quality (Fig. 2b) in which several structures, such as the spinal cord, limb buds, facial features and cerebral ventricles were easily identified. Further correction of image artifact, by co-registering the serially acquired image volumes to correct for embryo displacements over the course of the scan, enabled visualization of finer features including the basilar artery and other vascular structures (Fig. 2c). By plotting the magnitude of SG data, maternal respiratory motion could be monitored ( Fig. 2d). The k-space lines acquired during TR periods where the SG magnitude exceeded threshold were excluded from image reconstruction.
Fig. 2.
Comparison of reconstructed 3D images with and without gating and co-registration. A close to midsagittal view of an E14.5 embryo, with anterior (A) and posterior (P) marked. a) Reconstructed image without any respiratory gating with obvious motion artifacts. b) Alleviation of motion artifacts from respiration with rejection of k-space lines contaminated by motion, allowing the visualization of several structures such as spinal cord (SC), third ventricle (3V), choroid plexus (CP), hind limb (HL), and facial features (FF). c) Sharper resolution, especially of vascular features, such as the basilar artery (BA), obtained by co-registration of all the acquired volumes recovered with the use of a rigid-body registration step. d) Respiratory motion characterization with SG signals. Data above the threshold line are excluded from the reconstruction.
In utero imaging results at multiple developmental stages
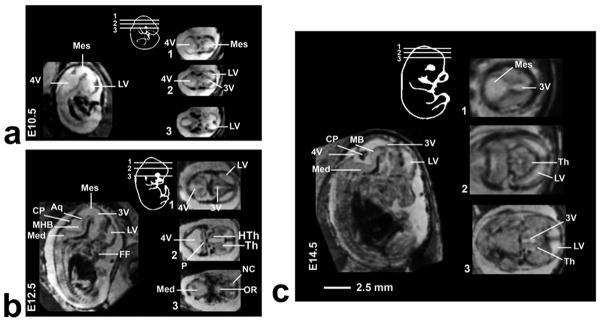
Figure 3 shows longitudinal imaging of the same pregnant mouse at three different gestational stages. At each stage the approximate position of the 2D horizontal slices taken from the 3D images are shown schematically. The cerebral ventricles could be identified as early as E10.5. At E12.5 the relative size of the ventricle decreased and additional brain structures such as the thalamus, hypothalamus and choroid plexus became evident. At E14.5 these structures further increased in size while the relative size of ventricle decreased. This was more easily visualized by segmenting the brain ventricles (Fig. 4a). Volumetric analysis of the segmented ventricular structures revealed an almost two-fold increase in the head of the embryos for every two days of development, while the ventricular volume remained almost constant (Fig. 4b). Computing the relative volume of the ventricles (the ratio of the ventricle to whole-brain volumes) made this trend more evident (Fig. 4c).
Fig. 3.
Mid-sagittal views of E10.5 (a), E12.5 (b) and E14.5 (c) embryos that show the difference in contrast between the different types of tissue. For each stage a schematic inset is presented to show the approximate position of the 2D transverse slices taken from the 3D images. Abbreviations: aqueduct (Aq), choroid plexus (CP), fourth ventricle (4V), facial features (FF), hypothalamus (HTh), lateral ventricle (LV), medulla oblongada (Med), mesencephalic vesicle (Mes), mid-hind brain junction (MHB), neopallial cortex (NC), optic recess (OR), thalamus (Th), third ventricle (3V).
Fig. 4.
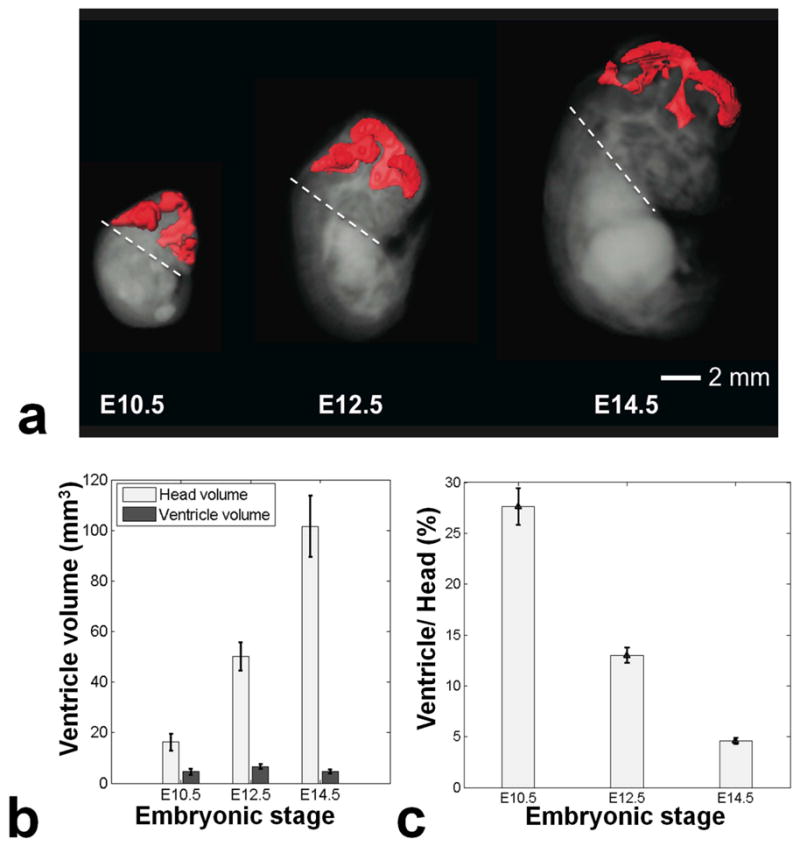
a) Segmentation of the ventricles at E10.5, E12.5 and E14.5. The dashed line represents the lower limit of the head that was used for volumetric calculations. b) A chart showing the volume of the head of the embryos together with the volume of the ventricles. The error bars represent the standard deviation between different embryos. c) The ventricle-to-head volume ratio decreases with increasing developmental stage.
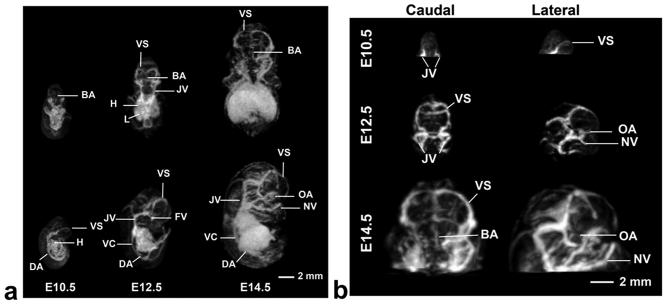
Contrast inversion, as described earlier, was used for the same datasets to highlight the originally hypo-intense vascular structures. An example of longitudinal imaging of the same timed-pregnant mouse is presented in Fig. 5. In the MIPs (Fig. 5a), major blood vessels including the dorsal aorta and venous sinus were discernible at all stages. Growth and elaboration of the cerebral vasculature tree was particularly well visualized between E10.5 and E14.5 (Fig. 5b).
Fig. 5.
a) 3D MIPs show the developing vasculature. Individual embryos staged at E10.5, E12.5 and E14.5 are viewed dorsally (top panels) and from the side (bottom panels) showing the increase in vascular pattern complexity at each developmental stage. b) MIPs highlighting the cerebral vasculature of the developing mouse brain that is increasing in complexity from E10.5 (top) to E14.5 (bottom). At E10.5 the jugular vein (JV), and the venous sinus (VS) can be distinguished. At E12.5 and E14.5 additional arteries and veins can also be identified. Abbreviations: basilar artery (BA), dorsal aorta (DA), facial vein (FV), heart (H), jugular vein (JV), liver (L), nasal vein (NV), optical artery (OA), vena cava (VC), and venous sinus (VS).
Other embryonic structures of interest are displayed in Fig. 6. MIPs at two embryonic stages (E12.5 and E14.5) are compared to demonstrate spinal cord and limb bud formation. At E12.5, the digits in the hind limbs could first be visualized (Fig. 6b), and by E14.5 the digits were completely separated. In the spinal cord, the intersomitic vessels (Fig. 6c) could be distinguished from mid-trunk to the anterior tail region (Fig. 6c). Taken together, these results demonstrate that in utero MRI can detect developmental changes in the early-stage mouse embryo at high resolution.
Fig. 6.
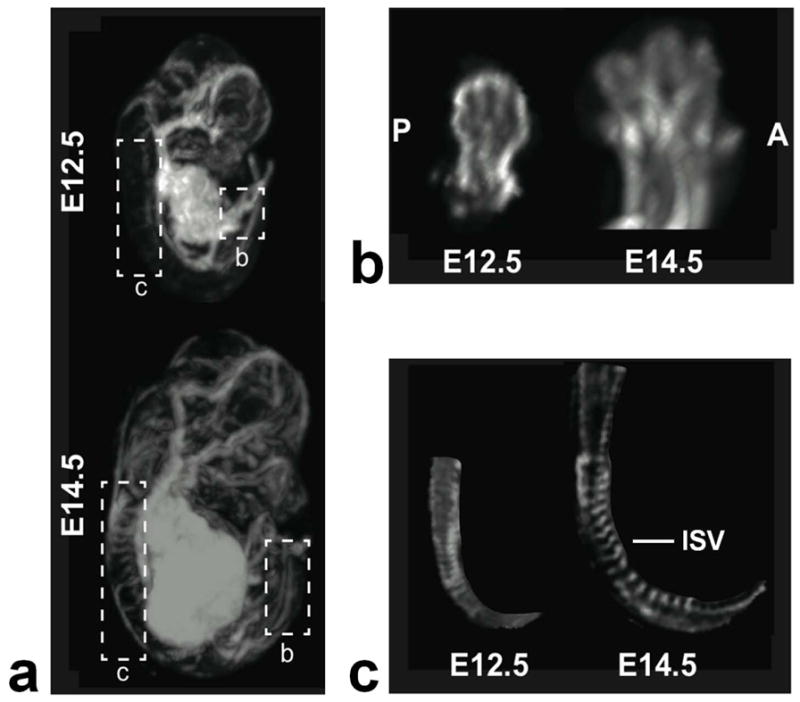
a) MIPs of an E12.5 (top) and E14.5 (bottom) embryos highlighting the spinal cord and the hind-limbs. B) Magnified views of the hind-limb at both stages, oriented to show the anterior (A) to posterior (P) arrangement of the developing digits. At E12.5, there is evidence of digits, which are separated by E14.5. c) The intersomitic vessels (ISV) can be distinguished at the two stages from the mid-trunk region to the beginning of the tail.
DISCUSSION
Traditionally, phenotyping with MRI has been performed on fixed embryos, but longitudinal imaging of individual animals can be a more powerful approach for studying the dynamics of mammalian development. In this work we have presented a method of imaging mouse embryos from stages as early as E10.5, at the onset of organogenesis. This study aimed to reconstruct highly detailed anatomical images, capable of showing multiple phenotypes when imaging genetically-engineered mice.
In utero MRI, like other abdominal imaging experiments, is susceptible to motion related artifacts that limit image quality. In this work, we have shown that maternal respiration and embryonic motion can be accommodated to reconstruct artifact free images and visualize vascular, facial and other features. These approaches might be employed for phenotype analysis of the En1 and Wnt1 knockout mice, for instance, which have both CNS and limb phenotypes (31,32). The described procedure can also be used for vascular imaging. The data also suggests that imaging of the mouse embryo is possible as early as E10.5, which in principle enables analysis of phenotypes longitudinally.
In our previous work we studied vascular differences between wild-type and Gli2 mutant mouse embryos (8,25). We showed that there was excellent correlation between images acquired with self-gated in vivo MRI, ex vivo MRI and histological data in identifying the deletion of the basilar artery, variable alteration of posterior cerebral artery and overall differences in the Circle of Willis. However, the diameter of blood vessels appeared wider in the in vivo MRI method, compared to ex vivo, due to the T2* contrast caused by susceptibility effect of fetal blood. Similarly, in the current study, using a TE of 20 ms, accurate segmentation of the heart was not possible in any of the three developmental stages, although we have shown previously that embryonic cardiac imaging is possible at shorter TE (24). Therefore, for a given phenotype (or phenotypes) under study, the sequence parameters that affect image contrast, namely, flip angle, repetition time and echo time, will have to be optimized. In addition, in order for any in vivo imaging sequence to be used as a valid quantitative tool, its results must be benchmarked against the more established ex vivo methods (i.e. ex vivo MRI and histology).
In MRI, for a given acquisition time, there is always a trade-off between SNR and resolution. In this study we have focused on acquiring high-resolution (100 μm isotropic) images of a single embryo per mouse, within a 2 – 3 h imaging session. Higher throughput can be achieved if lower resolution (or SNR) is sufficient to study certain phenotypes. Imaging at 125 μm resolution, for example, using the current setup would require a quarter of the acquisition time in order to achieve the same SNR, assuming a square root relationship between acquisition time and SNR (33). We could therefore image four embryos in a 2 – 3 h session at 125 μm isotropic resolution. The ability to image a higher number of embryos during an imaging session will depend on the SNR and resolution needed to study the phenotypes of interest.
A common problem in longitudinal embryonic imaging is the identification of exactly the same embryo for follow-up imaging. In our application of the pulse sequence, we imaged the same pregnant mouse longitudinally but did not ensure the same embryo was being imaged. It was sometimes possible to identify certain embryos in small litters by carefully positioning the pregnant mouse and using anatomical features of the mother, such as the bladder, for reference. However, in larger litters the embryos in the middle of the uterine horns remain difficult to identify in consecutive imaging sessions. A recent report describing an MRI method identifying embryos based on placental blood flow as measured by arterial spin labeling represents a potential solution to the embryo identification problem (34). This method could potentially be implemented prior to the high-resolution self-gated sequence, adding 10–15 min to the total experiment time.
The results of this work suggest that embryonic development can be studied with the use of SG MRI methods from an early stage, at a high resolution, with excellent contrast, and without the use of any exogenous contrast agents. This type of non-invasive longitudinal approach makes possible the study of the dynamics of phenotype development that occur in utero, and will be of interest in future study of genetically-engineered mice. This possibility will in turn bring new insights into the genetic control of mammalian development and elucidate the role of altered development in a wide spectrum of human diseases.
Acknowledgments
This work was supported by NIH grants R01 HL078665 and R01 NS038461. We thank Orlando Aristizabal for technical assistance.
LIST OF ABBREVIATIONS
- 2D/3D
Two/three dimensional
- AP
Anterior-posterior
- bpm
Breaths per minute
- CNS
Central nervous system
- E
Embryonic day
- GRE
Gradient echo
- MIP
Maximum intensity projection
- NVOL
Number of volumes acquired
- RF
Radio frequency
- SG
Self-gated
- SNR
Signal-to-noise ratio
- UBM
Ultrasound biomicroscopy
References
- 1.Waterston RH, Lindblad-Toh K, Birney E, Rogers J, Abril JF, Agarwal P, Agarwala R, Ainscough R, Alexandersson M, An P, Antonarakis SE, Attwood J, Baertsch R, Bailey J, Barlow K, Beck S, Berry E, Birren B, Bloom T, Bork P, Botcherby M, Bray N, Brent MR, Brown DG, Brown SD, Bult C, Burton J, Butler J, Campbell RD, Carninci P, Cawley S, Chiaromonte F, Chinwalla AT, Church DM, Clamp M, Clee C, Collins FS, Cook LL, Copley RR, Coulson A, Couronne O, Cuff J, Curwen V, Cutts T, Daly M, David R, Davies J, Delehaunty KD, Deri J, Dermitzakis ET, Dewey C, Dickens NJ, Diekhans M, Dodge S, Dubchak I, Dunn DM, Eddy SR, Elnitski L, Emes RD, Eswara P, Eyras E, Felsenfeld A, Fewell GA, Flicek P, Foley K, Frankel WN, Fulton LA, Fulton RS, Furey TS, Gage D, Gibbs RA, Glusman G, Gnerre S, Goldman N, Goodstadt L, Grafham D, Graves TA, Green ED, Gregory S, Guigo R, Guyer M, Hardison RC, Haussler D, Hayashizaki Y, Hillier LW, Hinrichs A, Hlavina W, Holzer T, Hsu F, Hua A, Hubbard T, Hunt A, Jackson I, Jaffe DB, Johnson LS, Jones M, Jones TA, Joy A, Kamal M, Karlsson EK, Karolchik D, Kasprzyk A, Kawai J, Keibler E, Kells C, Kent WJ, Kirby A, Kolbe DL, Korf I, Kucherlapati RS, Kulbokas EJ, Kulp D, Landers T, Leger JP, Leonard S, Letunic I, Levine R, Li J, Li M, Lloyd C, Lucas S, Ma B, Maglott DR, Mardis ER, Matthews L, Mauceli E, Mayer JH, McCarthy M, McCombie WR, McLaren S, McLay K, McPherson JD, Meldrim J, Meredith B, Mesirov JP, Miller W, Miner TL, Mongin E, Montgomery KT, Morgan M, Mott R, Mullikin JC, Muzny DM, Nash WE, Nelson JO, Nhan MN, Nicol R, Ning Z, Nusbaum C, O’Connor MJ, Okazaki Y, Oliver K, Larty EO, Pachter L, Parra G, Pepin KH, Peterson J, Pevzner P, Plumb R, Pohl CS, Poliakov A, Ponce TC, Ponting CP, Potter S, Quail M, Reymond A, Roe BA, Roskin KM, Rubin EM, Rust AG, Santos R, Sapojnikov V, Schultz B, Schultz J, Schwartz MS, Schwartz S, Scott C, Seaman S, Searle S, Sharpe T, Sheridan A, Shownkeen R, Sims S, Singer JB, Slater G, Smit A, Smith DR, Spencer B, Stabenau A, Strange-Thomann NS, Sugnet C, Suyama M, Tesler G, Thompson J, Torrents D, Trevaskis E, Tromp J, Ucla C, Vidal AU, Vinson JP, von Niederhausern AC, Wade CM, Wall M, Weber RJ, Weiss RB, Wendl MC, West AP, Wetterstrand K, Wheeler R, Whelan S, Wierzbowski J, Willey D, Williams S, Wilson RK, Winter E, Worley KC, Wyman D, Yang S, Yang SP, Zdobnov EM, Zody MC, Lander ES Mouse Genome Sequencing C. Initial sequencing and comparative analysis of the mouse genome. Nature. 2002;420(6915):520–562. doi: 10.1038/nature01262. [DOI] [PubMed] [Google Scholar]
- 2.Collins FS Int Mouse Knockout C. A mouse for all reasons. Cell. 2007;128(1):9–13. doi: 10.1016/j.cell.2006.12.018. [DOI] [PubMed] [Google Scholar]
- 3.Nieman BJ, Wong MD, Henkelman RM. Genes into geometry: imaging for mouse development in 3D. Curr Opin Genetics Dev. 2011;21(5):638–646. doi: 10.1016/j.gde.2011.08.009. [DOI] [PubMed] [Google Scholar]
- 4.Henkelman RM. Systems biology through mouse imaging centers: Experience and new directions. Annu Rev Biomed Eng. 2010;12:143–166. doi: 10.1146/annurev-bioeng-070909-105343. [DOI] [PubMed] [Google Scholar]
- 5.Kaufman MH. The atlas of mouse development. London: Academic Press; 1994. [Google Scholar]
- 6.Smith BR, Johnson GA, Groman EV, Linney E. Magnetic-Resonance Microscopy of mouse embryos. P Natl Acad Sci USA. 1994;91(9):3530–3533. doi: 10.1073/pnas.91.9.3530. [DOI] [PMC free article] [PubMed] [Google Scholar]
- 7.Wadghiri YZ, Schneider AE, Gray EN, Aristizabal O, Berrios C, Turnbull DH, Gutstein DE. Contrast-enhanced MRI of right ventricular abnormalities in Cx43 mutant mouse embryos. NMR Biomed. 2007;20(3):366–374. doi: 10.1002/nbm.1113. [DOI] [PMC free article] [PubMed] [Google Scholar]
- 8.Berrios-Otero CA, Wadghiri YZ, Nieman BJ, Joyner AL, Turnbull DH. Three-dimensional micro-MRI analysis of cerebral artery development in mouse embryos. Magn Reson Med. 2009;62(6):1431–1439. doi: 10.1002/mrm.22113. [DOI] [PMC free article] [PubMed] [Google Scholar]
- 9.Jacobs RE, Ahrens ET, Dickinson ME, Laidlaw D. Towards a microMRI atlas of mouse development. Comput Med Imaging Grap. 1999;23(1):15–24. doi: 10.1016/s0895-6111(98)00059-7. [DOI] [PubMed] [Google Scholar]
- 10.Dhenain M, Ruffins SW, Jacobs RE. Three-dimensional digital mouse atlas using high-resolution MRI. Dev Biol. 2001;232(2):458–470. doi: 10.1006/dbio.2001.0189. [DOI] [PubMed] [Google Scholar]
- 11.Cleary JO, Modat M, Norris FC, Price AN, Jayakody SA, Martinez-Barbera JP, Greene NDE, Hawkes DJ, Ordidge RJ, Scambler PJ, Ourselin S, Lythgoe MF. Magnetic resonance virtual histology for embryos: 3D atlases for automated high-throughput phenotyping. NeuroImage. 2011;54(2):769–778. doi: 10.1016/j.neuroimage.2010.07.039. [DOI] [PubMed] [Google Scholar]
- 12.Mori S, Itoh R, Zhang J, Kaufmann WE, van Zijl PCM, Solaiyappan M, Yarowsky P. Diffusion tensor imaging of the developing mouse brain. Magn Reson Med. 2001;46(1):18–23. doi: 10.1002/mrm.1155. [DOI] [PubMed] [Google Scholar]
- 13.Phoon CKL, Turnbull DH. Ultrasound biomicroscopy-Doppler in mouse cardiovascular development. Physiol Genomics. 2003;14(1):3–15. doi: 10.1152/physiolgenomics.00008.2003. [DOI] [PubMed] [Google Scholar]
- 14.Aristizabal O, Ketterling JA, Turnbull DH. 40-MHz annular array imaging of mouse embryos. Ultrasound Med Biol. 2006;32(11):1631–1627. doi: 10.1016/j.ultrasmedbio.2006.05.020. [DOI] [PMC free article] [PubMed] [Google Scholar]
- 15.Hogers B, Gross D, Lehmann V, Zick K, De Groot HJM, Gittenberger-De Groot AC, Poelmann RE. Magnetic resonance microscopy of mouse embryos in utero. Anat Rec. 2000;260(4):373–377. doi: 10.1002/1097-0185(20001201)260:4<373::AID-AR60>3.0.CO;2-Q. [DOI] [PubMed] [Google Scholar]
- 16.Chapon C, Franconi F, Roux J, Marescaux L, Le Jeune JJ, Lemaire L. In utero time-course assessment of mouse embryo development using high resolution magnetic resonance imaging. Anat Embryol. 2002;206(1–2):131–137. doi: 10.1007/s00429-002-0281-6. [DOI] [PubMed] [Google Scholar]
- 17.Chapon C, Franconi F, Roux J, Le Jeune JJ, Lemaire L. Prenatal evaluation of kidney function in mice using dynamic contrast-enhanced magnetic resonance imaging. Anat Embryol. 2005;209(4):263–267. doi: 10.1007/s00429-004-0451-9. [DOI] [PubMed] [Google Scholar]
- 18.Plaks V, Kalchenko V, Dekel N, Neeman M. MRI analysis of angiogenesis during mouse embryo implantation. Magn Reson Med. 2006;55(5):1013–1022. doi: 10.1002/mrm.20881. [DOI] [PubMed] [Google Scholar]
- 19.Cohen B, Ziv K, Plaks V, Israely T, Kalchenko V, Harmelin A, Benjamin LE, Neeman M. MRI detection of transcriptional regulation of gene expression in transgenic mice. Nat Med. 2007;13(4):498–503. doi: 10.1038/nm1497. [DOI] [PubMed] [Google Scholar]
- 20.Deans AE, Wadghiri YZ, Berrios-Otero CA, Turnbull DH. Mn enhancement and respiratory gating for in utero MRI of the embryonic mouse central nervous system. Magn Reson Med. 2008;59(6):1320–1328. doi: 10.1002/mrm.21609. [DOI] [PMC free article] [PubMed] [Google Scholar]
- 21.Larson AC, White RD, Laub G, McVeigh ER, Li DB, Simonetti OP. Self-gated cardiac cine MRI. Magn Reson Med. 2004;51(1):93–102. doi: 10.1002/mrm.10664. [DOI] [PMC free article] [PubMed] [Google Scholar]
- 22.Brau ACS, Brittain JH. Generalized self-navigated motion detection technique: Preliminary investigation in abdominal imaging. Magn Reson Med. 2006;55(2):263–270. doi: 10.1002/mrm.20785. [DOI] [PubMed] [Google Scholar]
- 23.Hiba B, Richard N, Janier M, Croisille P. Cardiac and respiratory double self-gated cine MRI in the mouse at 7 T. Magn Reson Med. 2006;55(3):506–513. doi: 10.1002/mrm.20815. [DOI] [PubMed] [Google Scholar]
- 24.Nieman BJ, Szulc KU, Turnbull DH. Three-dimensional, in vivo MRI with self-gating and image coregistration in the mouse. Magn Reson Med. 2009;61(5):1148–1157. doi: 10.1002/mrm.21945. [DOI] [PMC free article] [PubMed] [Google Scholar]
- 25.Berrios-Otero CA, Nieman BJ, Parasoglou P, Turnbull DH. In utero phenotyping of mouse embryonic vasculature with MRI. 2012;67(1):251–257. doi: 10.1002/mrm.22991. [DOI] [PMC free article] [PubMed] [Google Scholar]
- 26.Collins DL, Neelin P, Peters TM, Evans AC. Automatic 3D intersubject registration of MR volumeteric data in standardized Talairach space. J Comput Assist Tomogr. 1994;18(2):192–205. [PubMed] [Google Scholar]
- 27.Shepp LA, Logan BF. Fourier reconstruction of a head section. IEEE Trans Nucl Sci. 1974;NS21(3):21–43. [Google Scholar]
- 28.Segars WP, Tsui BMW, Frey EC, Johnson GA, Berr SS. Development of a 4-D digital mouse phantom for molecular imaging research. 2004;6(3):149–159. doi: 10.1016/j.mibio.2004.03.002. [DOI] [PubMed] [Google Scholar]
- 29.Ahrens ET, Srinivas M, Capuano S, Simhan HN, Schatten GP. Magnetic resonance imaging of embryonic and fetal development in model systems. Methods Mol Med. 2006;124:87–101. doi: 10.1385/1-59745-010-3:87. [DOI] [PubMed] [Google Scholar]
- 30.Lustig M, Donoho D, Pauly JM. Sparse MRI: The application of compressed sensing for rapid MR imaging. Magn Reson Med. 2007;58(6):1182–1195. doi: 10.1002/mrm.21391. [DOI] [PubMed] [Google Scholar]
- 31.Parr BA, Shea MJ, Vassileva G, McMahon AP. Mouse WNT genes exhibit discrete domains of expression in the early embryonic CNS and limb buds. Development. 1993;119(1):247–261. doi: 10.1242/dev.119.1.247. [DOI] [PubMed] [Google Scholar]
- 32.Wurst W, Auerbach AB, Joyner AL. Multiple developmental defects in engrailed-1 mutant mice - an early mid-hindbrain deletion and patterning defects in forelimbs and sternum. 1994;120(7):2065–2075. doi: 10.1242/dev.120.7.2065. [DOI] [PubMed] [Google Scholar]
- 33.Haacke EM, Brown R, Thompson M, Venkatesan R. Magnetic resonance imaging: physical properties and sequence desing. New York: Wiley & sons; 1999. [Google Scholar]
- 34.Avni R, Raz T, Biton IE, Kalchenko V, Garbow JR, Neeman M. Unique in utero identification of fetuses in multifetal mouse pregnancies by placental bidirectional arterial spin labeling MRI. Magn Reson Med. doi: 10.1002/mrm.23246. [DOI] [PMC free article] [PubMed] [Google Scholar]


