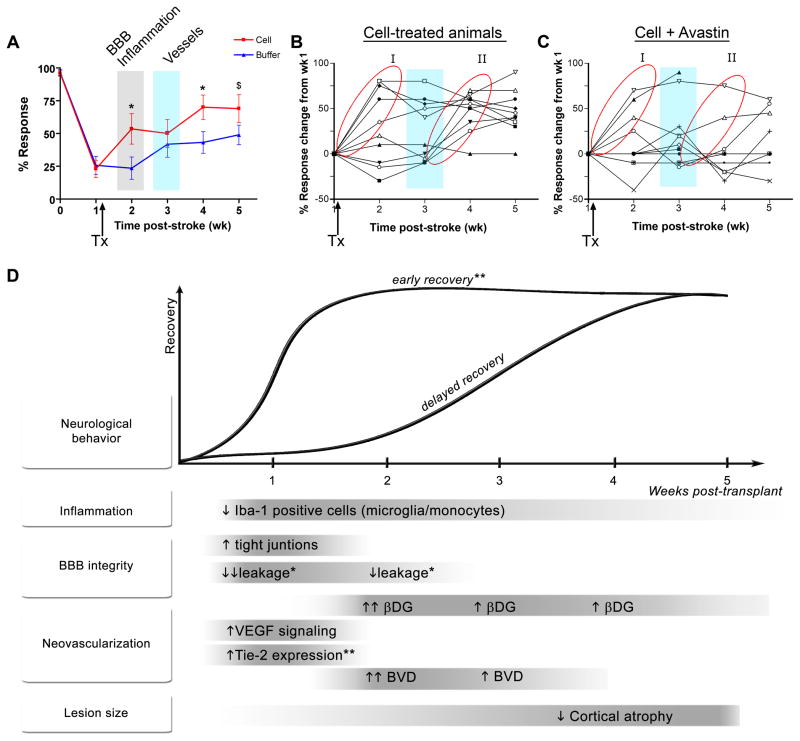
Figure 7. Correlation of hCNS-SCns-induced recovery with hCNS-SCns-induced brain changes.
(A) Overlaying the recovery graph with timing of hCNS-SCns-induced brain changes reveals that early cell-enhanced recovery occurs before changes in neovascularization. (B) Graph of the behavioral response of individual cell-treated animals reveals two distinct groups of recovery, I and II. (C) Graph of the behavior response of individual cell/Avastin-treated animals; Avastin blocks recovery of Group II. Arrow indicates time of transplantation (TX). Blue vertical bar: time of peak neovascularization. (D) Schematic summarizing the changes induced by transplanted hCNS-SCns and the temporal relationship of these events to each other and to hCNS-SCns-enhanced functional recovery. Avastin affected all parameters except for the ones marked *. Inconclusive effects of Avastin are indicated by **.

