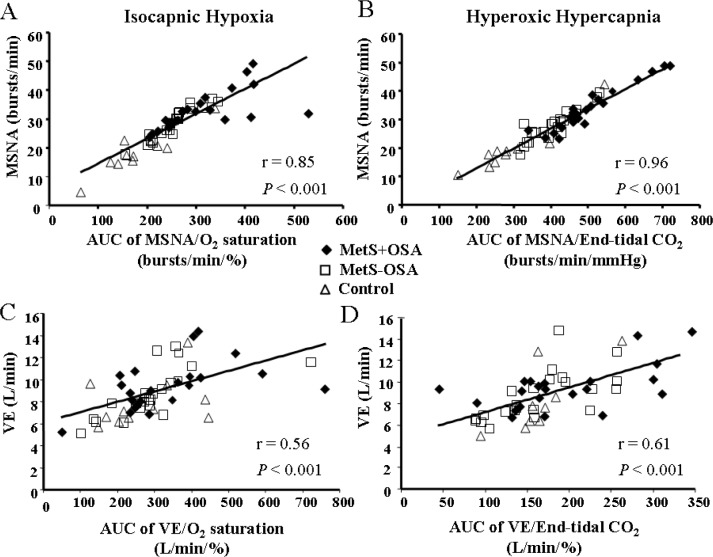
Figure 4.
Correlation coefficient between area under the curve (AUC) of change in muscle sympathetic nerve activity (MSNA) per change in oxygen saturation during isocapnic hypoxia with baseline of MSNA - Peripheral chemoreflex sensitivity (A), correlation coefficient between AUC of change in MSNA per change in end-tidal carbon dioxide during hyperoxic hypercapnia with baseline of MSNA - Central chemoreflex sensitivity (B), correlation coefficient between AUC of change in min ventilation (VE) per change in oxygen saturation during isocapnic hypoxia with baseline of VE (C) and correlation coefficient between AUC of change in VE per change in end-tidal carbon dioxide during hyperoxic hypercapnia with baseline of VE (D).

