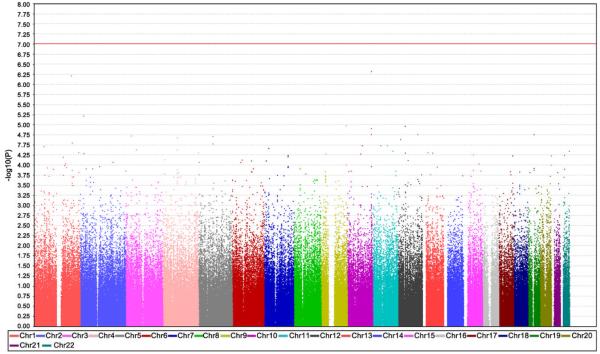
Fig. 1.
Whole genome SNP association study. The plot displays the degree of association of particular SNPs with SALS: the x-axis displays SNPs chromosomal position and the y-axis shows -log10(P value obtained by allelic association test). The red line represents threshold for significance after Bonferroni correction for multiple testing. (Data from Schymick J, Scholz SW, Fung H-C et al. Genome-wide genotyping in amyotrophic lateral sclerosis and neurologically normal controls. Lancet Neurol 2007;6(4):322–8.)

