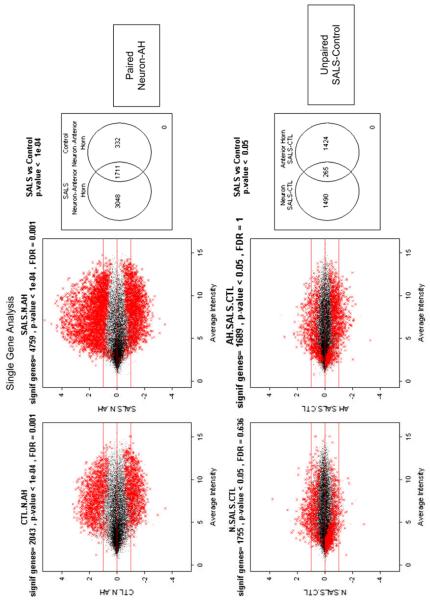
Fig. 2.
Differential gene expression. The plots show gene expression in motor neurons and anterior horns in lumbar spinal cords of SALS. The motor neurons were isolated from the surrounding anterior horn using a technique called laser capture microdissection, which allows histologic sections to be dissected with a specialized microscope. Gene expressions were performed using a technology called whole genome oligonucleotide microarray, which measure expression of each gene. The top plots compare anterior horns to motor neurons in control (left) and SALS (right); the bottom plots compare SALS to control in the neurons (left) and anterior horn (right.) (Data from John Ravits, MD, unpublished.)

