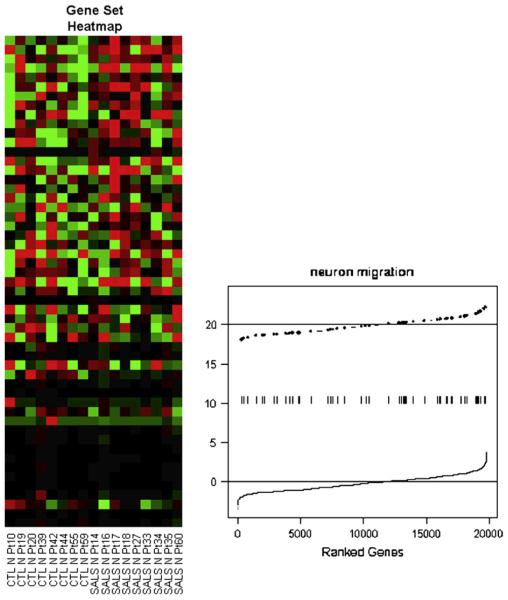
Fig. 3.
Differential gene set expression. The plots show the neuron migration pathway of 54 genes that seems to be up-regulated in SALS motor neurons. The left plot shows what is called a heat map, which is a way of visualizing patterns. In the example, the groups of interest are in columns (control on the left and SALS on the right) and the genes in the pathway of interest are in rows (the top rows are the most differentiated between the groups). The right had plot shows the overall up-regulation (shift to the right) in the expression levels of these genes. (Data from John Ravits, MD, unpublished.)

