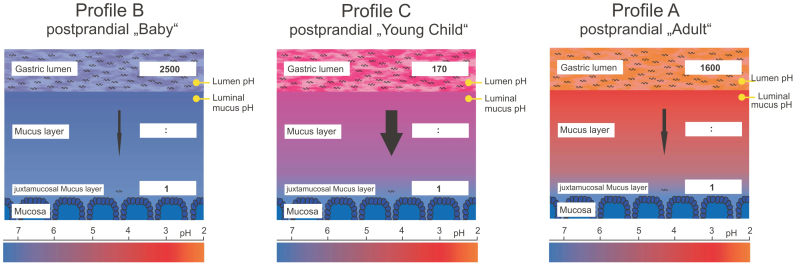
Figure 6. Schematical model summarizing the results from both experimental setups.
Depicted is the pH gradient within the mucus layer and the luminal pH by coloration gradient (as measured in guinea pig experiments), as well as the colonization ratio following postprandial conditions (from Mongolian gerbil experiments).

