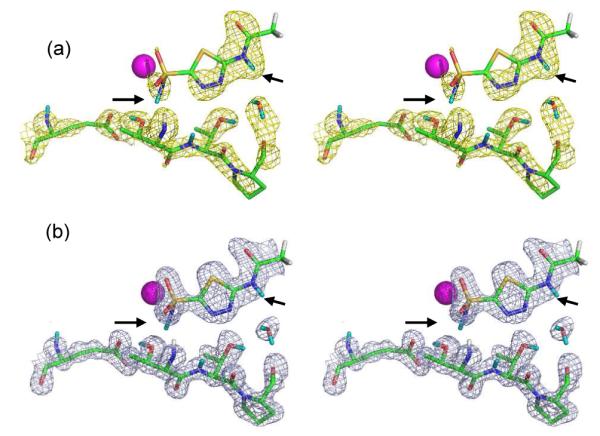
Figure 4.

Complementarity of electron and nuclear density maps. Stereo stick representation of the active site of HCA II with AZM bound (PDB ID 4g0c). D atoms on AZM are indicated by black arrows. (a) Nuclear density map is shown in yellow and is contoured at 1.5 σ; (b) Electron density map is shown in blue and is contoured at 2.0 σ. Residue labeling is as shown in Figure 3.
