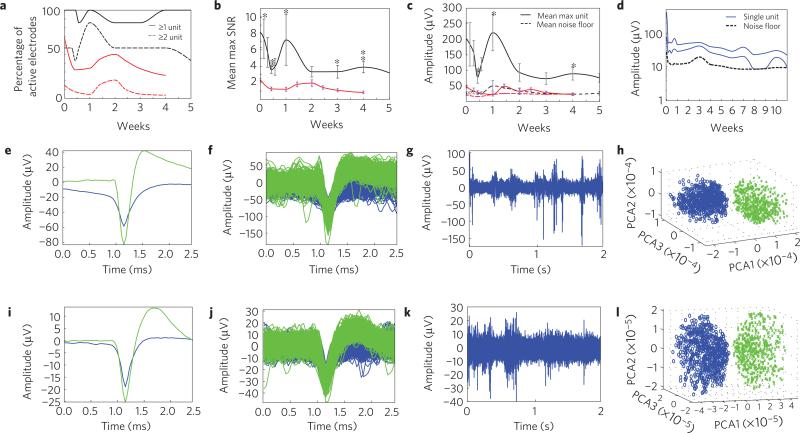
Figure 5. Chronic in vivo recording capabilities of MTEs.
a, Percentage of active chronically implanted MTEs (black, N = 7) and silicon probes (red, N = 80 sites, 5 probes) able to detect at least 1 single unit (solid line) or at least 2 single units (dashed line) as a function of weeks post-implantation. b, Mean SNR of the largest single unit detected on each electrode for MTE (black, N = 7) and silicon probes (red, N = 80). Error bars indicate s.e.m.;* and ** indicate two-tailed, unequal variance statistical significance, p < 0.05 and p < 0.01, respectively. c, Mean amplitude of the largest single unit detected on each electrode (solid line), and the mean noise floor of each electrode (dashed line) for MTEs (black, N = 7) and silicon electrodes (red, N = 80). Error bars indicate s.e.m.; * indicates two-tailed, unequal variance statistical significance, p < 0.05. d, Amplitude of two distinct single units detected on the same electrode from the longest implant (solid, blue) starting at 408 μV on day 0. Amplitude of the noise floor from the same animal (dashed, black). For the purpose of this figure, when only one single unit was detected, the second amplitude was considered to be the same as the noise floor. e–h, Electrophysiological recordings taken from a rat with a MTE implanted in M1 five weeks post-implantation. i–l, Electrophysiological recordings taken from a different rat implanted with a MTE in M1 seven weeks post-implantation. e,i, Mean waveform of discernible single units. f,j, Piled single units from 2 min of recordings. g,k, Representative example of 2 s of high-speed recordings. h,l, Results from PCA showing distinct clusters.

