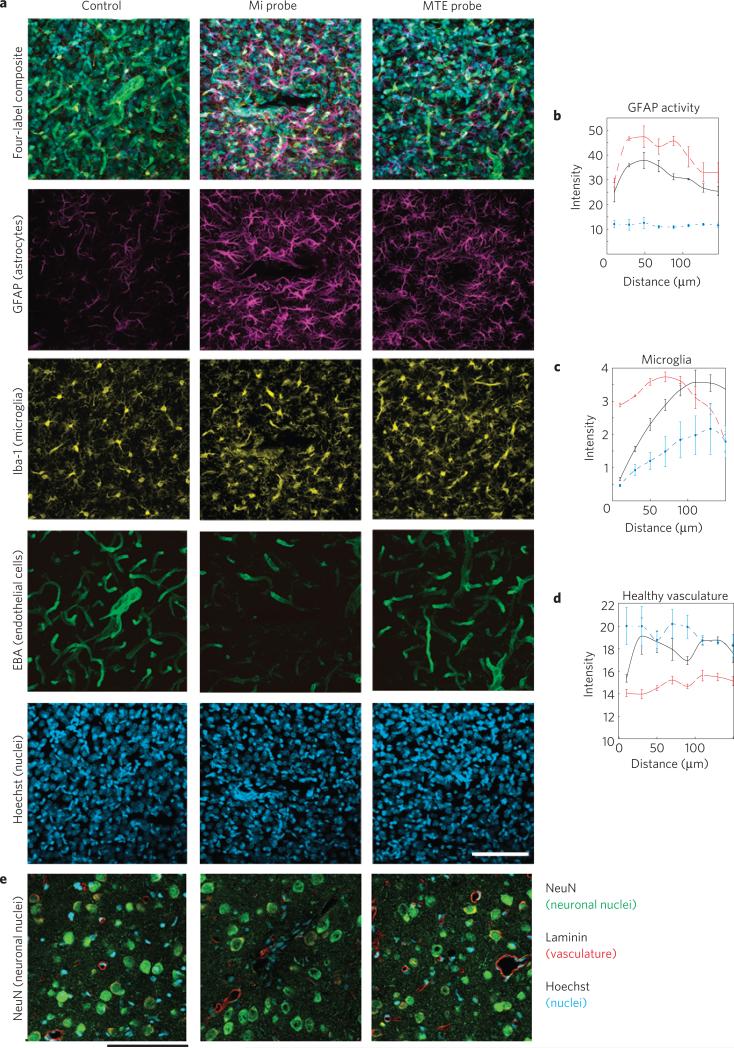
Figure 6. Histological comparison of tissue reaction to chronically implanted microthread and silicon probes.
a, Tissue responses in motor cortex following a two-week implantation of a planar silicon electrode (centre), MTE (right) and a negative control from the contralateral hemisphere (left). Tissues are labelled for astrocytes (purple), microglia (yellow), BBB/endothelial cells (green) and nuclei (blue). Scale bar, 100 μm. b–d, Fluorescent intensity profile with increasing distance from the probe surface for MTE (solid black), silicon probe (dashed red) and control tissue (dash–dot blue). Error bars show s.e.m. b, Astrocyte GFAP activity. c, Microglia IBA-1 intensity. d, Healthy endothelial cells. e, Neurons (green), vasclature (red) and cell nuclei (blue) of a planar silicon electrode (centre), MTE (right) and a negative control from the contralateral hemisphere (left) from a separate tissue sample. Scale bar, 100 μm.

