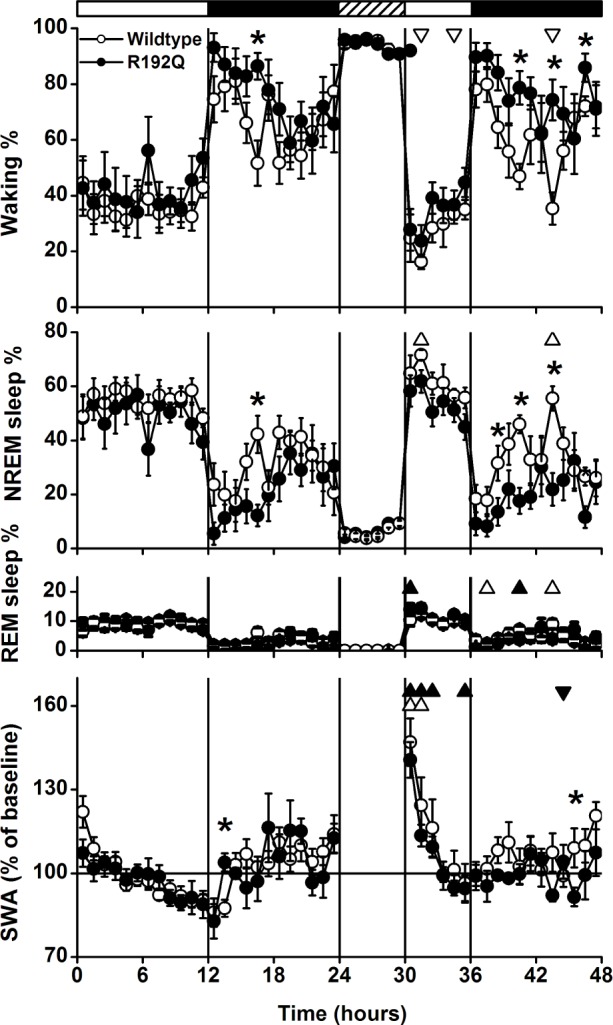
Figure 1.

Time course of vigilance states and slow-wake activity (SWA, mean EEG power density between 0.75-4.0 Hz) in non-rapid eye movement (NREM) sleep for baseline, the 6-h sleep deprivation (SD, hatched bar) and 18-h recovery for the 2 genotypes (wild-type n = 8, R192Q n = 8). Curves connect mean 1-h values (mean ± SEM) of NREM sleep, REM sleep, waking and SWA in NREM sleep. SWA is expressed relative to the mean 24-h baseline value (= 100%). The vertical lines and black and white bars indicate the light dark cycle and the SD. Significant differences between baseline and recovery within a genotype are indicated by open (wild-type) and closed (R192Q) triangles (P < 0.05, 2-tailed paired t-test after significant analysis of variance [ANOVA] factor treatment). Orientation of triangles indicates the direction of deviation from baseline. Asterisks indicate significant differences between wild-type and Cacna1a R192Q (P < 0.05, 2-tailed t-test after significant ANOVA factor genotype).
