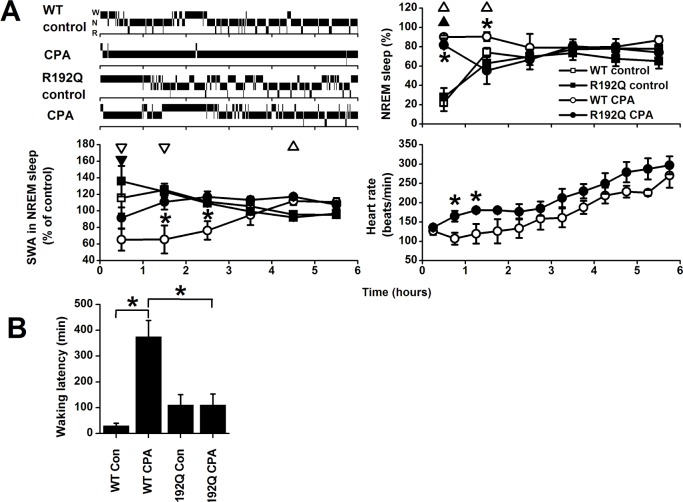
Figure 4.
A. Top left: Individual hypnograms of a wild-type (WT) and Cacna1a R192Q (R192Q) mouse during the first 6 h after saline (control) or cyclopentyladenosine (CPA) injection showing the occurrence of waking (W), non-rapid eye movement (N) sleep, and REM (R) sleep in 1-min intervals. Time course of non-rapid eye movement (NREM) sleep-like state (Top right), slow wave activity (SWA) in the NREM sleep-like state (Bottom left), and heart rate in NREM sleep-like state (Bottom right) after injection with saline (control) or cyclopentyladenosine (CPA) in wild-type (WT, n = 6) and Cacna1a R192Q (R192Q) mice (n = 6). Curves connect mean 1-h values (± SEM) of NREM sleep and SWA and mean 30-min values of heart rate for the first 6 h after the injection. Significant differences between control and CPA are indicated by open (WT) or closed (R192Q) triangles (P < 0.05, 2-tailed paired t-test, after significant analysis of variance [ANOVA]). Orientation of triangles indicates the direction of deviation from baseline Asterisks indicate significant differences between wild-type and Cacna1a R192Q (P < 0.05, 2-tailed t-test after significant ANOVA interaction treatment*genotype). B: Latencies to waking or wake-like state after saline (Con) or CPA treatment in WT and R192Q mice. Asterisks indicate significant differences between treatment (P < 0.05, 2-tailed paired t-test) or wild-type and Cacna1a R192Q (P < 0.05, 2-tailed t-test after significant ANOVA interaction treatment*genotype P < 0.05).

